Experiences and Lessons Learned
Background
Anemia is a major public health problem. Global estimates of those affected by anemia include 43 percent of children under age five, 29 percent of non-pregnant women, and 38 percent of pregnant women (Stevens et al 2013). In Nepal, the overall prevalence of anemia is 46 percent among children age 6–59 months and 35 percent among women of reproductive age (Nepal DHS 2011).
Anemia is a complex condition with many direct and indirect causes. Poor nutrition (including inadequate iron, vitamin A, folic acid, vitamin B12, and zinc intake), infections (malaria, helminthic infections, and chronic infections like HIV and tuberculosis), and genetics (thalassemia and sickle cell anemia) directly influence anemia status (Balarajan et al 2011). Anemia prevention efforts require synergy between nutrition-specific and nutrition-sensitive interventions. Nutrition-specific interventions such as dietary interventions, infant and young child feeding (IYCF), disease control, supplementation, and fortification are best addressed by the health sector, while nutrition-sensitive interventions are best conducted within the agriculture, education, and social welfare sectors, and some public health departments like reproductive health and water and sanitation.
Progress to reduce anemia globally has been slow (IFPRI 2016). This is partly due to the multiple causes of anemia, and the multi-sectoral and integrated approach needed to address it. Many countries have sound national policies but their translation to a program implementation at the sub-national level is lacking. With increasing decentralization of health systems, program managers need to prioritize anemia interventions and strengthen decision-making processes at the district and sub-district levels. These managers have limited access to reliable district-level data. An approach to prioritizing interventions is to identify risk factors for anemia in a specific population and assess the adequacy of current programming to address these factors.
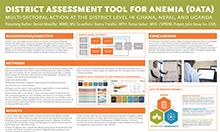
SPRING has developed a District Assessment Tool for Anemia (DATA) to assist countries in strengthening anemia programming at the district level. The target audience for DATA is district-level program managers and planners, who can use the DATA tool to assess the main factors that cause anemia, identify enablers and barriers to addressing anemia, and prioritize interventions to combat it. Thus, the objective of DATA is to: (1) increase understanding among district-level personnel about anemia and its causes; (2) determine the presence of policies, programs and coverage related to evidence-based interventions to address the most important local causes of anemia; and (3) guide an analytic process to help prioritize activities and interventions most likely to address the most important local causes of anemia.
DATA is a Microsoft Excel-based tool comprised of seven tabs including input and output tabs. The input tabs cover information related to anemia at the national- and district-levels. The output is presented in the form of two visually informative dashboards, reflecting both the prevalence of anemia and its risk factors, as well as information on policy, program status, program coverage, and barriers to implementation for various sectoral interventions. DATA is implemented at a two-day facilitated workshop, and it is accompanied by a Facilitator’s Guide that provides instruction on implementing DATA in a district. A User’s Guide to DATA also exists to provide context and information on the tool to the user.
In Nepal, the MSNP developed under the umbrella of the NPC, envisions the various sectors (health, education, urban development, federal affairs and local development, agriculture and livestock) managing their own programs but with multisector coordination, and corroboration by the NPC and the DDC at the central and local levels, respectively. The NNFSS under the NPC, coordinates and works with various sectors and partners for the implementation and expansion of MSNP to the districts (GoN, NPC 2013). UNICEF is spearheading the monitoring and evaluation (M&E) framework for the MSNP. DATA can be implemented within the context of MSNP in Nepal.
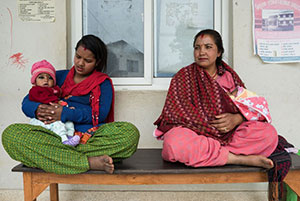
As a first step, SPRING and HKI, in partnership with UNICEF, carried out an exploration of the relevance and feasibility of DATA in Kailali district, with district program officers and the district nutrition and food security coordination committees (DNFSCC), placed within the implementation framework of the MSNP. The positive feedback from this exploration was shared with CHD, NPC, and NNFSS, and they approved the full implementation of the tool in Kapilvastu district.
Implementation
SPRING conducted the implementation of DATA in Nepal in two steps in September 2016. First, we engaged in “ground-truthing” at a half-day national workshop in Kathmandu. This was followed by a two-day district-level workshop in Kapilvastu, a MSNP district in the Western Development Region.
The “ground-truthing” exercise solicited feedback from the perspective of national level stakeholders on usability and relevance to districts across the country. National workshop attendees included officials from the NPC, NNFSS, CHD, and various ministries of the Government of Nepal. Other attendees were from USAID/Nepal; UNICEF; Council for Technical Education and Vocational Training (CTEVT); Local Development Training Academy (LDTA); the International Organization for Migration (IOM); the World Food Programme (WFP); and several NGOs including Save the Children, Helvetas Swiss Intercooperation, Action Contre La Faim (ACF), and Plan International. The agenda and participants list are included in Annex 1.
One day prior to the scheduled district-level workshop, the DATA workshop facilitators met with officials at the district headquarters and the district health office (DHO) in Kapilvastu. Facilitators also reviewed available sources of data in the annual report at the office.
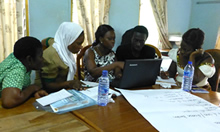
The two-day district workshop involving district-level staff from different government sectors, NGOs, and USAID implementing partners was held in Taulihawa, the administrative headquarters of Kapilvastu district. The government sectors included: District Health Office, District Livestock Service Office, District Development Committee, District Agriculture Development Office, District Education Office, Water Supply and Sanitation Sub-Divisional Office, and the Women and Children’s Office.
The workshop also included participants from USAID projects like SUAAHARA, Knowledge-based Integrated Sustainable Agriculture and Nutrition (KISAN), Health for Life, and Business for Literacy. The NGOs included: Sunshine Social Development Organization, Social Development and Promotion Centre, Sakriya Sewa Samaj, Kapilvastu Integrated Development Services, Kalika Self-Reliant Social Centre, Non-Governmental Organization Coordination Committee. Representatives from the United Nations Population Fund (UNFPA), national-level representatives from NNFSS, NPC, and UNICEF, who had participated in the Kathmandu workshop, were also present to observe the implementation of the tool in the district. The agenda and participants list are included in Annex 2.
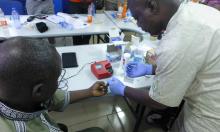
The first day started with presentations about anemia, multi-sectoral efforts for anemia prevention and control, and the rationale for the creation of DATA. The rest of the first day focused on a collaborative exercise during which participants entered their data into the tool. The data included:
- anemia prevalence information from various population groups
- prevalence of risk factors for anemia
- coverage data for interventions related to anemia from different sectors, including
- nutrition (iron-folic acid supplementation; vitamin A supplementation, micronutrient powders; and breastfeeding practices)
- disease control (malaria and helminthic infection prevention and treatment measures)
- water, sanitation, and hygiene (safe water supply, treatment of water for consumption, hygiene/handwashing, and improved sanitation)
- reproductive health (usage of modern methods of family planning and delayed cord clamping)
- agriculture (promotion of iron-rich foods and home food production including gardening, and livestock breeding/animal husbandry programs).
Sources of data included the health management information system, the logistics management information system, programmatic reports, surveys, and other sources. The outputs of the tool (dashboards) are included in Annex 3.
The second day, the DATA facilitators led participants through a prioritization process, based on the outputs of the first day. Participants assessed the barriers to implementation of the intervention in four key areas: - commodity availability, funding, provider skills/training and client demand – and entered these in the tool. Apart from these four, the other main areas that the participants identified as crucial to implementation included: sectoral coordination, human resources, program follow up, political instability, program coverage, collective decision-making/planning process, awareness, underlying poverty issues, underlying gender issues, absence of data, lack of nutrition planning, results-oriented programming needs, activation of village committees, and involvement of community mother’s groups.
Using these prioritized issues, and reviewing the output from the tool, participants divided into sectoral groups as indicated in DATA: health (which included nutrition, disease control, reproductive health), water and sanitation, education, and agriculture (which included livestock), to prioritize anemia program action. Each sectoral group was led by a participant from that sector and comprised members from other sectors to ensure cross-sectoral discussion.
Afterward, each group provided a list of prioritized sectoral interventions and detailed feedback on how the DATA output was used to create the list. The list of prioritized activities were translated to proposed activities for inclusion in next year's district work plan. The list is included in Annex 4.
SPRING recorded feedback from participants from both workshops during the workshop sessions, collated, qualitatively analyzed, and presented within the domains of interest: relevance and applicability, and implementation in the Nepali context. District-level participants were invited to complete a workshop evaluation assessment that asked about the workshop objectives and the conduct of the workshop. The workshop evaluation form is included in Annex 5.
Findings
The National Consultation Workshop
SPRING recorded feedback from national workshop participants during the half-day workshop when facilitators presented the DATA concept and demonstrated use of the tool itself. We have presented the feedback from participants. The National Consultation Workshop was framed around the use of DATA to address the high levels of anemia in women, children, and adolescent girls, as this is a priority area under Nepal’s MSNP.
General Comments
General comments on anemia related to anemia testing, identifying different causes for it, and tailoring interventions to the causes within the Nepali context.
Relevance and Applicability of the Tool
The majority of the comments and feedback at the national consultation related to the relevance and applicability of DATA in Nepal.
- There is benefit to using DATA alongside other monitoring tools: It was remarked that DATA is not a data collection tool, but it collates available data and in the absence of data, it allows for decision-making and prioritization of activities. Having the output of two dashboards may make it easier to prompt action, rather than having a 25-page activity or monitoring report.
- DATA can be used even when there is sparse quantitative data at the district level: It was noted that the input data for anemia may be either quantitative or qualitative. DATA recognizes that district officials have a wealth of knowledge and experience to make subjective assessments in the absence of quantitative values for anemia prevalence or program coverage. However, the participants can utilize their subjective opinion after reaching consensus with other workshop members, with a documentation of the rationale and discussion in the notes. This allows for action even in the absence of data. At the same time, this also serves as advocacy for collecting data, as it made participants aware of data gaps and the need to generate better data related to anemia.
- DATA is a platform to bring all sectors together: Even though anemia is considered a technical problem, the solution lies in the multi-sectoral space. The DATA tool, within the format of a workshop and in its design, recognizes all of the sectors that have a role to play in anemia prevention and control. When sectoral representatives realize their contributions to the prevention and control of anemia, they can act within their sectors and jointly with other sectors. The DDC / NFSSC found it useful for joint planning and allotment of funds as per sectoral needs in next year's Government of Nepal (GoN)/Ministry of Federal Affairs and Local Development (MOFALD) budget.
- Customization is built into the implementation of DATA: It was noted that contextualization happens in the process of the DATA workshop. The indicators, the barriers to program implementation, the departments involved in implementation, and other factors are considered in both the assessment and prioritization process. It engaged all sectors in extensive discussions to identify barriers and facilitating factors to implementation that are context-specific, and may also be cross-cutting.
- DATA can be linked to the MSNP M&E framework: The MSNP gathers data from the Nutrition Surveillance System, facility level data from the sector management information system, and food security data from the Nepal Food Security Monitoring System or Nepal Khadya Surakshya Anugaman Pranali (NeKSAP). UNICEF sees the role of DATA to be a complement to NSS, MIS, and NeKSAP, as an additional source that collects all anemiarelated data. It is also a strength for each sector to include data from it in their sector monitoring and evaluation plan.
- Implementation of DATA may be opportune for the second phase of MSNP: A participant noted that the timing for implementing DATA is important because “the MSNP implementation is moving into its second phase…. may be an opportune time to assess if DATA will work in Nepal.” DATA could be used to set priorities for anemia action under MSNP Phase II.
Conclusion
It is clear from the feedback at the National Consultation Workshop that anemia is multisectoral, that Nepal has a multi-sectoral plan for nutrition, and that DATA could be used to strengthen its efforts. The national consultation workshop participants saw the importance of assessing the feedback and perspectives from district-level staff in Kapilvastu.
The District Workshop
We recorded feedback from district-level workshop participants during sessions over the two days, including when participants completed data entry, during the analysis of outputs in the small groups that carried out the prioritization exercise, and during the final presentation of priority actions. Participants also provided feedback through evaluation forms. Feedback is presented below with selected narrative quotes from participants.
Relevance and Applicability of DATA
The majority of comments and feedback on the relevance and applicability focused on how interventions would have an impact on anemia, coverage of programs, and lack of education and awareness on anemia. Participants found DATA relevant to support them in planning for anemia control by sector, with the added value of all the sectors working together at the same time to develop an implementation plan.
- DATA encouraged participants to look at their sectoral interventions from an implementation perspective. For example, a participant from the agriculture sector asked how much agricultural production is needed to combat anemia. It was noted that you need to have enough production to feed all households and it should be a mix of animal source and micronutrient-rich foods. Production, distribution, and consumption are very different concepts, but the first step is to produce nutritious foods. Similar views around implementation were obtained from the other sectors.
- Participants recognized the need for multi-sectoral coordination while using DATA in the workshop. Participants realized that in order to achieve significant reductions in anemia, all the sectoral interventions need to work together. This was highlighted during a discussion on the current trend in Kapilvastu of increased intake of junk foods at home instead of nutritious homemade foods. It was recognized that interventions in the district will have to focus on the promotion of iron-rich foods (which is included in the DATA tool), but expand this to micronutrient-rich food, both plant and animal foods (through the livestock sector) foods, and cover both market and home-based foods in the discussion.
- DATA highlighted the lack of public awareness as a barrier to prevention of anemia. All the sectors agreed that they have to work together at the ground level to raise awareness.
- DATA allowed the participants to recognize the existing interventions, and barriers to their implementation. The participants understood that understanding the situation around the interventions included in the tool and the related issues (barriers and enablers) related to their effective implementation will help sectors prioritize activities to strengthen programming for anemia prevention and control.
- Implementation of DATA may be opportune for the second phase of MSNP. Participants also agreed that there was value in using DATA during the second phase of the MSNP (2018-2022), where reduction in anemia was noted as an important goal.
Implementation of DATA
Participants found DATA to be user-friendly and informative.Overall, participants were appreciative of seeing how all the data and assessments they had entered in the tool were reflected on the two dashboards in DATA. They remarked on the risk factors related to anemia found in the overview dashboards- that the higher risk factors seem to be iron deficiency and helminth infection, while the lower risk factors are malaria and Vitamin A deficiency.
They were able to identify patterns in program coverage. For instance, they noted that the nutrition sector had overall good coverage, the disease sector was mixed, water and sanitation had good coverage except for drinking water treatment, education sector had high coverage for deworming but low coverage for hygiene education. (See the dashboards of the Kapilvastu DATA tool in Annex 3 for further information.)
- DATA motivated participants to collect better data. Participants remarked that by going through the qualitative classification, which was subjective, they were motivated to advocate for further quantitative data collection on anemia in the district.
- DATA encouraged the use of appropriate indicators. Participants noted that program coverage changes based on the indicators selected to represent it. For example, although there is 68 percent coverage of access to adequate sanitation, when using the indicators for completely hygienic toilet use, the use of improved sanitation is really only 20 percent. There were also discussions around using facility-based quantitative data to be representative of the whole community, with a consensus that these indicators for the local context would have to be considered after discussion.
- DATA had the potential to establish anemia-related indicators by sector and gather data accordingly. The DATA exercise encouraged stakeholders to think and work in generating anemia-related data at the local level.
Prioritization of Anemia Interventions
- DATA made it easier to prioritize anemia action. The sectoral groups were able to prioritize actions based on the outputs of the tool, identification of key implementation factors, and barriers and enablers to each intervention. (See list of prioritized actions in Annex 4).
- DATA encouraged participants to think about planning and multi-sectoral coordination at the district level. Participants debated on the need for a proper planning system that reduces duplication of programs and allows for integrating across sectors in a collaborative fashion.
- Use of a facilitator for DATA implementation was critical. A facilitator guided participants through the process of incorporating the output from the DATA tool (two dashboards) into their decision-making process to prioritize actions.
- DATA was not the only resource for planning. Participants noted that the lack of data in certain areas made it more challenging to prioritize anemia actions. However, they became more aware of the gaps in data and the need to advocate for more data collection and use. Participants also recognized that the prioritization decision depends on external factors beyond those presented in the tool. For example, some of the implementation factors like delayed release of the budget, political instability, and collective decision making/planning process lie outside the purview of the tool. Nevertheless, they are important and should be included in the prioritization discussion.
- DATA had the potential for advocating for and allocating funding towards anemia prevention and control. The plan of action lists developed by each sector was proposed activities for undertaking in the next fiscal year.
District Workshop Evaluation
Evaluation results indicate that 100 percent of participants understood the multifactorial causes of anemia, 90 percent understood the importance of context-specific, multisectoral approaches to successfully address anemia, and 86 percent had learned how to use DATA to prioritize district-level anemia prevention and control programs. Eighty-six percent of participants also said they anticipated the use of DATA for district-level prioritization of anemia programs in the future.
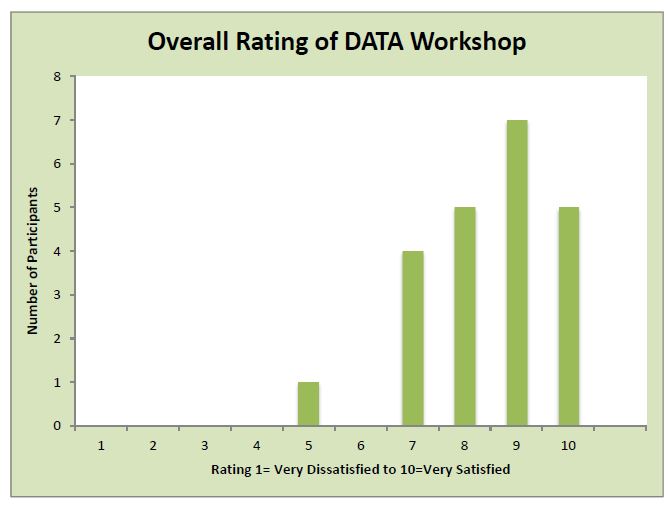
The median rating for the overall workshop was 9 out of a maximum of 10. Figure 1 shows the participants’ ratings. The major finding from the evaluation was the need to translate all materials and conduct the workshop entirely in Nepali.
Figure 1: Participants’ Ratings
Participants also provided feedback on the conduct of the workshop. The evaluation domains, and some of the illustrative comments are presented below.
Why participants anticipate using DATA again in the future:
“I anticipate the use of DATA for district level because we can get information and condition of anemia and we can make plan how to go through with this.”
“It is easy to identify the gaps and plan of action.”
“It is very much contextual and objective.”
“The DATA helps us know the situation of programs at community level, available resources, demand side factors, and gaps. It will help us achieve the aims and contribute to the targeted people. From this we know our situation and it makes it easy for future planning.”
The value of collaborating across multiple sectors:
“This is a serious problem and only one factor cannot reduce or control it- that is why all sectors are fully responsible to make plans and implement at the ground level.”
“Linkage and cross and interrelated relationships of all programs.”
The organization of the workshop, positives:
“Mostly liked the information about anemia because anemia is a serious disease.”
“Development of the dashboards and the decision framework for prioritization.”
“Software used to identify problems/gaps.”</p>
“The presenters and their ability to teach and facilitate the trainees.”
“It had detailed discussion about anemia, its causes, and way forward in the planning process.”
“Open discussion, active participation.”
The organization of the workshop, negatives:
“Problem in bilingual conversation.”
“In some cases long discussions, but no conclusions.”
“I think it could have been a few more days.”
“Language barrier.”
“Data entry system because you don’t have practical access.”
Conclusion
The feedback from the district workshop concluded that the participants saw DATA as a useful tool for anemia program planning and action. They stressed the need for a Nepali version of the tool and the related materials.
Summary
Four main findings emerged from the implementation of DATA in Nepal.
- The implementation in Kapilvastu demonstrated that DATA met its objective to increase awareness about the multifactorial causes of anemia and the need for a multi-sectoral effort to prevent and control it. DATA is an excellent platform to increase awareness of the causes of anemia and the means to address them. Using the tool and analyzing the outputs allowed participants to appreciate the multi-faceted nature of anemia and the benefits of an integrated multi-sectoral action plan to control and prevent anemia.
- The DATA output is useful to prioritize anemia action, with additional input from factors determined by the district-level staff to be relevant to their specific context. The prioritized list of actions can be incorporated into action plans within the annual district workplan.
- The need to customize the facilitation around the tool to each district’s context needs to be balanced with the broad applicability of the tool across different districts in Nepal. The National and District Questionnaires include questions and use indicators that do not necessarily reflect each district’s situation. It is therefore critical for groups to discuss the indicators and assessments of program coverage and come to a consensus for input into the tool. The Indicators Table in the tool allows for recording the deviations in indicators, and justifications recorded for each indicator or qualitative assessment utilized in the notes tab.
- DATA is applicable to the Nepali context and is a good fit as a decision-making and planning tool for anemia, which is one of the main outcomes for the MSNP. Participants were able to use the tool effectively, and prioritize interventions that will not only alleviate anemia but will ultimately have an impact on nutrition outcomes of the MSNP. Based on the results of the implementation, government stakeholders can explore how DATA can fit into the monitoring and evaluation framework, as the MSNP continues into its second phase of implementation (2018-2022).
Additionally, throughout the process of implementation, SPRING documented important lessons learned for DATA in Nepal. The following lessons are pertinent for successful implementation:
- Coordination of government stakeholders and partners was essential: The implementation of DATA was only possible through the joint efforts of the government agencies (NPC, NNFSS, and CHD) and partners, along with the facilitation by SPRING. HKI and UNICEF were interested in having a district-level decision-making tool for anemia, prompted by the critical need to address anemia in Nepal, as a key outcome of the MSNP.
- Holding a national consultation workshop for orientation of stakeholders: The orientation of stakeholders at the national level was essential to validate the use of DATA. Senior government officials could therefore understand the purpose and use of DATA, view a demonstration of the tool, and share their perspectives on the tool and the plan for implementation in Nepal.
- Inclusion of national representatives at the district workshop: Representatives from the NPC, NNFSS, and UNICEF attended, observed, and participated in the Kapilvastu workshop. This was vital to get their perspectives and inputs in the process and create a link between national and district level efforts for anemia prevention and control. It also allowed them to reflect on how DATA could fit into the MSNP framework.
- Prepare the district government ahead of time: SPRING created pre-workshop information sheets to send to district officers prior to the workshop. These information sheets included discussion about DATA and expectations for the workshops. For district officials, the information sheets identified the kinds of data inputs that were needed for the tool and requested that invited officials bring all relevant data to district workshop.
- Conduct pre-workshop visit in the district to meet with invited officials: Two weeks prior to the district workshop, the HKI/SPRING consultant visited Kapilvastu and met key stakeholders. He briefed them about the workshop objectives and collection of anemia related information. Again, the day before the district workshop, SPRING and HKI met with the district headquarters and district health office in Kapilvastu to refresh them about the tool and its uses. The team also clarified last minute queries about the workshop and reiterated the need to bring data from all sectors to the workshop.
- Ensure a district presence through partners: HKI through the SUAAHARA project and UNICEF are working in Kapilvastu on a number of programs, as an MSNP district. Their connections and work with the government district officials was essential for the success for the district workshop, and helped ensure full participation during the district workshop.
- Spend time charting the district officials’ decision-making framework, even if they do not explicitly follow one, and subsequently try to draw linkages between their framework and the factors considered in the DATA tool. Each sector came up with essential factors for implementation, and these were then matched with the factors that are presented in the tool. Based on the prioritized list of actions, each sector developed key activities for inclusion in the next year's annual plan.
- Identify areas where DATA can assist in the prioritization process: In assessing the outputs of the tool and the implementation factors in the tool, it is useful to know where DATA can help make informed decisions about prioritization, and areas where there are gaps and further information is needed through group discussions and consensus.
Next Steps
- SPRING and HKI will share the findings of the implementation of DATA in Kapilvastu with NPC, CHD, NNFSS, and UNICEF.
- Moving forward in Kapilvastu:
- The DDC/NNFSS Committee in Kapilvastu will incorporate the list of activities developed in the DATA workshop into the planning and budgeting for the MSNP for the next fiscal year. This will be included in the budgets sent by the MoFALD to the district.
- The DDC/ NNFSS Committee plans to translate this exercise to the level of the Village Development Committee (VDC) to interact with VDC/NNFSS Committee members. It is integral for VDCs to understand anemia and the activities for anemia prevention and control using a multisectoral approach.
- DDC/VDC NNFSS Committee will seek local government funds and engagement for anemia reduction activities for vulnerable, ultra-poor families in the community.
- SPRING will update the guides accompanying DATA - Facilitator’s and User’s Guides - based on feedback from the implementation in Kapilvastu. SPRING will also develop a short step-by-step guide for facilitators at the district level in Nepal.
- SPRING will provide funding to HKI to translate DATA materials into Nepali. These materials include:
- Facilitator’s Guide, to be used by the facilitator at the district-level workshop;
- User’s Guide, which describes the structure of the tool as well as the various elements of the tool, and includes instructions on how to navigate the tool;
- Pre-workshop materials to be distributed to the participants prior to the workshop, which lay out expectations of workshop participants, and details of the data that the participants are expected to bring;
- A training of trainers curriculum developed from the instructions in the facilitator’s guide.
- Consultation with national stakeholders and planning focal persons with the aim of:
- Capacity building for district SUAAHARA teams to conduct DATA exercise, and use of information to support the DDC/NNFSS and VDC/NNFSS;
- Continuous technical support to all stakeholders;
- Coordination with all district level stakeholders to help them generate data on anemia at the local level and use it for sectoral planning of activities to contribute to anemia reduction; and
- Supporting DDC/ NNFSS Committee to undertake joint planning, implementation, monitoring, and evaluation of MSNP activities for anemia reduction.
- HKI will share the results of this implementation with USAID’s SUAAHARA project, to explore the potential for implementing DATA within SUAAHARA.
- UNICEF and HKI will scale up DATA to additional districts in the next year, to align with the second phase of implementation of the MSNP.
References
Balarajan, Yarlini et al. 2011. “Anaemia in Low-Income and Middle-Income Countries.” Lancet 378 (9809): 2123–35. doi:10.1016/S0140-6736(10)62304-5.
Government of Nepal. National Planning Commission. 2013. Multi-sector Nutrition Plan: For Accelerating the Reduction of Maternal and Child Under-nutrition in Nepal 2013-2017 (2023).
International Food Policy Research Institute. 2016. Global Nutrition Report 2016: From Promise to Impact: Ending Malnutrition by 2030. Washington, DC.
Population Division, Ministry of Health and Population, Government of Nepal, New ERA, Kathmandu, Nepal and ICF International. 2012. "Nepal Demographic and Health Survey 2011.", Calverton, Maryland, USA: MOHP, GON,New Era, and ICF International.
Stevens, Gretchen A. et al. 2013. “Global, Regional, and National Trends in Haemoglobin Concentration and Prevalence of Total and Severe Anaemia in Children and Pregnant and Non-Pregnant Women for 1995–2011: A Systematic Analysis of Population-Representative Data.” The Lancet Global Health 1 (1): e16–25. doi:10.1016/S2214-109X(13)70001-9.