Introduction
Levels of micronutrients added to fortified foods in Uganda must meet the standards set by the Uganda National Bureau of Standards (UNBS). These levels are set to significantly increase the population’s micronutrient intake of vitamin A, iron, and iodine to help reduce micronutrient deficiencies. These deficiencies can only be managed if the fortified products contain adequate nutrients.
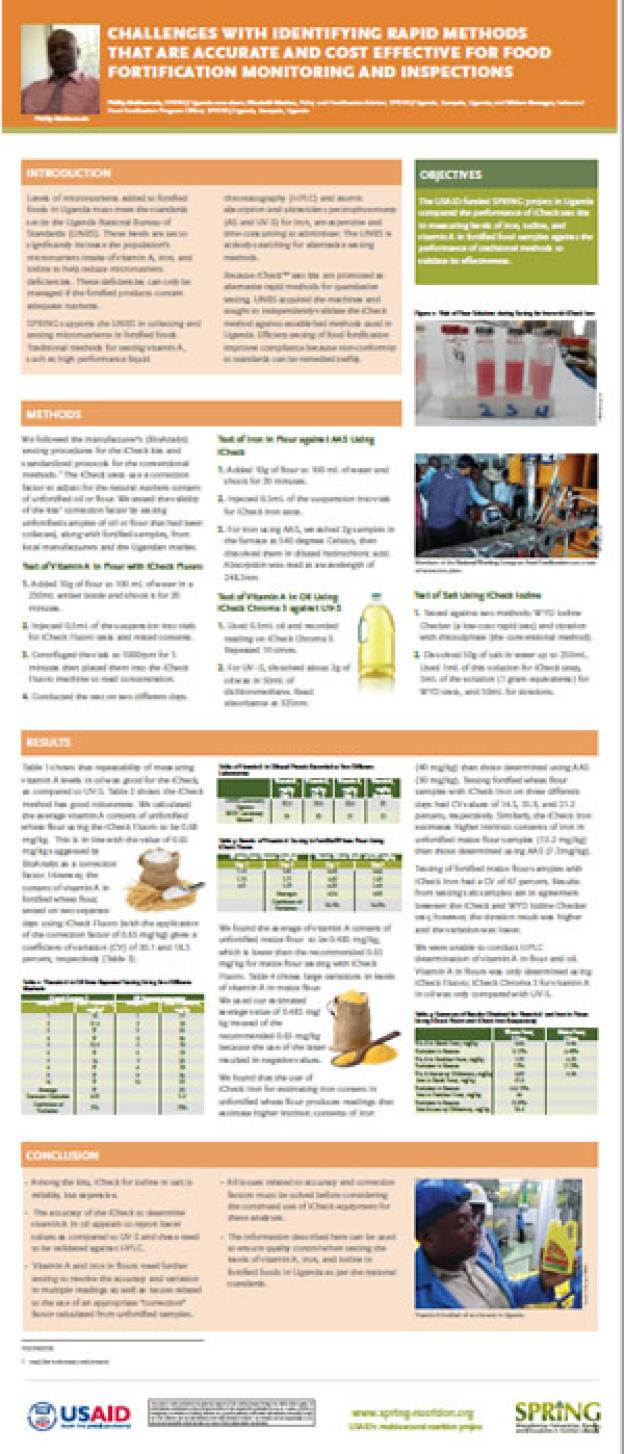
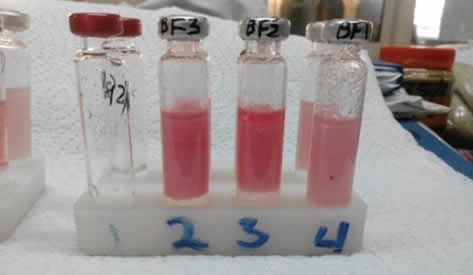
Figure 1: vials of Flour solutions during testing for iron with icheck iron
SPRING supports the UNBS in collecting and testing micronutrients in fortified foods. Traditional methods for testing vitamin A, such as high performance liquid chromatography (HPLC) and atomic absorption and ultraviolet spectrophotometry (AS and UV-S) for iron, are expensive and time consuming to administer. The UNBS is actively searching for alternative testing methods.
Because iCheck™ test kits are promoted as alternative rapid methods for quantitative testing, UNBS acquired the machines and sought to independently validate the iCheck method against established methods used in Uganda. Efficient testing of food fortification improves compliance because non-conformity to standards can be remedied swiftly.
Objective
The USAID-funded SPRING project in Uganda compared the performance of iCheck test kits in measuring levels of iron, iodine, and vitamin A in fortified food samples against the performance of traditional methods to validate its effectiveness.
Methods
We followed the manufacturer’s (BioAnalyt) testing procedures for the iCheck kits and standardized protocols for the conventional methods.1 The iCheck tests use a correction factor to adjust for the natural nutrient content of unfortified oil or flour. We tested the validity of the kits’ correction factor by testing unfortified samples of oil or flour that had been collected, along with fortified samples, from local manufacturers and the Ugandan market.
Test of Vitamin A in Flour with iCheck Fluoro
- Added 10g of flour to 100mL of water in a 250mL amber bottle and shook it for 20 minutes.
- Injected 0.5mL of the suspension into vials for iCheck Fluoro tests and mixed contents.
- Centrifuged the vials at 1000rpm for 5 minutes then placed them into the iCheck Fluoro machine to read concentration.
- Conducted the test on two different days.
Test of Iron in Flour against AAS using iCheck
- Added 10g of flour to 100mL of water and shook for 20 minutes.
- Injected 0.5mL of the suspension into vials for iCheck iron tests.
- For iron using AAS, we ashed 2g samples in the furnace at 540 degrees Celsius, then dissolved them in diluted hydrochloric acid. Absorption was read at a wavelength of 248.3nm.
Test of Vitamin A in Oil Using iCheck Chroma 3 against UV-S
- Used 0.5mL oil and recorded reading on iCheck Chroma 3. Repeated 10 times.
- For UV–S, dissolved about 2g of oil in 50mL of dichloromethane. Read absorbance at 325nm.
Test of Salt Using iCheck Iodine
- Tested against two methods: WYD IodineChecker (a low-cost rapid test) and titration with thiosulphate (the conventional method).
- Dissolved 50g of salt in water up to 250mL. Used 1mL of this solution for iCheck tests, 5mL of the solution (1 gram equivalents) for WYD tests, and 50mL for titrations.
Results
Table 1 shows that repeatability of measuring vitamin A levels in oil was good for the iCheck, as compared to UV-S. Table 2 shows the iCheck method has good robustness. We calculated the average vitamin A content of unfortified wheat flour using the iCheck Fluoro to be 0.68 mg/kg. This is in line with the value of 0.65 mg/kg suggested by BioAnalyt as a correction factor. However, the content of vitamin A in fortified wheat flour, tested on two separate days using iCheck Fluoro (with the application of the correction factor of 0.65 mg/kg) gives a coefficient of variation (CV) of 30.1 and 18.5 percent, respectively (Table 3).
Table 1: Vitamin A in oil from repeated testing using two different methods
| iCheck Chroma 3 | UV Spectrophotometer | ||
|---|---|---|---|
| Sample ID | Conc. Vitamin A, mg/kg* | Sample ID | Conc. Vitamin A, mg/kg |
| 1 | 16 | 1 | 31 |
| 2 | 17.5 | 2 | 25 |
| 3 | 17 | 3 | 24 |
| 4 | 17 | 4 | 20 |
| 5 | 16.5 | 5 | 25 |
| 6 | 17 | 6 | 23 |
| 7 | 18 | 7 | 22 |
| 8 | 17 | 8 | 25 |
| 9 | 17 | 9 | 20 |
| 10 | 17 | 10 | 22 |
| Average | 17 | 24 | |
| Standard Deviation | 0.53 | 3.2 | |
| Coefficient of Variation | 3% | 13% | |
We found the average of vitamin A content of unfortified maize flour to be 0.485 mg/kg, which is lower than the recommended 0.65 mg/kg for maize flour testing with iCheck Fluoro. Table 4 shows large variations in levels of Vitamin A in maize flour. We used our estimated average value of 0.485 mg/kg instead of the recommended 0.65 mg/kg because the use of the latter resulted in negative values.
Table 2: Vitamin A in diluted premix recorded at two different laboratories
| Vitamin A, mg/kg Day 1 | Vitamin A, mg/kg Day 2 | Vitamin A, mg/kg Day 3 | Vitamin A, mg/kg Average | |
|---|---|---|---|---|
| UNBS Laboratory Uganda | 22.5 | 22.5 | 22.5 | 23 (rounded) |
| MOH Laboratory Malawi | 19 | 23 | 21 | 21 |
We found that the use of iCheck Iron for estimating iron content in unfortified wheat flour produces readings that estimate higher intrinsic contents of iron (40 mg/kg) than those determined using AAS (30 mg/kg). Testing fortified wheat flour samples with iCheck Iron on three different days had CV values of 14.5, 35.9, and 21.2 percent, respectively. Similarly, the iCheck Iron estimates higher intrinsic contents of iron in unfortified maize flour samples (13.2 mg/kg) than those determined using AAS (7.2mg/kg).
Table 3: Results of vitamin A testing in fortified wheat flour using iCheck Fluoro
| Wheat Flour Results (mg/kg) | Results Minus Blank of 0.65 mg/kg | ||
|---|---|---|---|
| Day 1 | Day 2 | Day 1 | Day 2 |
| 1.14 | 1.36 | 0.46 | 0.68 |
| 1.15 | 1.71 | 0.47 | 1.03 |
| 0.9 | 1.73 | 0.22 | 1.05 |
| Average | 0.38 | 0.92 | |
| Coefficient of Variation | 30.1% | 18.5% | |
Testing of fortified maize flour samples with iCheck Iron had a CV of 47 percent. Results from testing salt samples are in agreement between the iCheck and WYD Iodine checker test; however, the titration result was higher and the variation was lower.
Table 4: Summary of results obtained for vitamin A and iron in flours using iCheck Fluoro and iCheck Iron respectively
| Wheat Flour, 3 Days | Maize Flour, 2 Days | |
|---|---|---|
| Vit. A in Blank Flour, mg/kg | 0.68 | 0.48 |
| Variation in Results | 5-17% | 8-49% |
| Vit. A in Fortified Flour, mg/kg | 1.33 | 0.76 |
| Variation in Results | 13% | 7-12% |
| Vit. A Added by Difference, mg/kg | 0.65 | 0.28 |
| Iron in Blank Flour, mg/kg | 41.6 | |
| Variation in Results | 0.6-13% | |
| Iron in Fortified Flour, mg/kg | 80 | |
| Variation in Results | 9-23% | |
| Iron Added by Difference, mg/kg | 38.4 |
We were unable to conduct HPLC determination of vitamin A in flour and oil. Vitamin A in flours was only determined using iCheck Fluoro; iCheck Chroma 3 for vitamin A in oil was only compared with UV-S.

Conclusion
- Among the kits, iCheck for iodine in salt is reliable, but expensive.
- The accuracy of the iCheck to determine vitamin A in oil appears to report lowervalues as compared to UV-S, and these need to be validated against HPLC.
- Vitamin A and iron in flours need further testing to resolve the accuracy and variation in multiple readings as well as issues related to the use of an appropriate “correction” factor calculated from unfortified samples.
- All issues related to accuracy and correction factors must be solved before considering the continued use of iCheck equipment for these analyses.
- The information described here can be used to ensure quality control when testing the levels of vitamin A, iron, and iodine in fortified foods in Uganda as per the national standards.