Sustainability of Improved Practices Following Graduation
SPRING/Bangladesh is a seven-year USAID-funded project focused on the 1,000-days approach, promoting Essential Nutrition Actions and Essential Hygiene Actions (ENA/EHA) by pregnant and lactating women (PLW) and children under two years of age. SPRING has worked in Bangladesh since 2012, using a multichannel, integrated approach for tackling malnutrition in 40 upazilas of Bangladesh using both nutrition-specific and nutrition-sensitive interventions. With the ENA and EHA as the technical foundation of our work, SPRING/Bangladesh focuses on the first 1,000 days of life, targeting PLW and their children as our primary audience, while also working with husbands and other family and community members.
We use multiple delivery channels, including SPRING-led farmer nutrition schools (FNS), as well as training partnerships with government health agents, agricultural extension agents, and development partner facilitators. Farmer nutrition schools are a nine-month long training activity that incorporates the advancement and support of ENA and EHA into promoted food production (PFP) training modules on vegetable gardening, poultry rearing, and fish production.
To measure changes plausibly brought about by the FNS program when implemented at scale, this study surveyed a cohort of women who participated in the FNS curriculum beginning in November 2014. The study collected data from a cohort of 440 women in 38 upazilas and interviewed participant women three times: before the beginning of the FNS sessions (phase 1), immediately after the FNS sessions were completed (phase 2), and one year after the completion of FNS activities (phase 3). The survey included questions about household sociodemographic characteristics, homestead food production, the consumption of poultry and fish, hygiene practices, dietary diversity of PLW, breastfeeding and complementary feeding practices of infants and young children, and the health and nutrition knowledge of the participants.
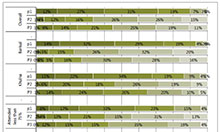
We identified many positive changes among the FNS participants; key indicators are listed in table 1. Participation in the FNS sessions was high, with over 80 percent of women attending 14 of the 18 sessions. Infant and young child feeding (IYCF) and nutrition knowledge increased, and vastly more households maintained handwashing stations at their homesteads. The proportion of households practicing all three elements of food production promoted through the FNS—gardening, poultry rearing, and fishpond management—increased. The quality of these activities also improved, with an increase in vegetable and fruit varieties grown, an increase in poultry raised, higher vaccination rates for poultry, and greater production of small indigenous fish species. Due, in part, to these behavior changes, the dietary diversity of women in the FNS improved significantly.
Farmer nutrition school participants continued engaging in promoted practices for at least one year after the completion of the FNS. Nutrition knowledge continued to increase, with only a 4 percent decline in the proportion of households with a handwashing station. The proportion of households raising poultry and tending gardens remained much higher than before the FNS, and the level of production—measured by number of varieties grown in gardens and number of chickens tended—also remained high. The proportion of households rearing small indigenous fish stayed at the same level in phase 3 as it was in phase 2. Dietary diversity of women remained at a high level, with over three-quarters of women consuming a minimally diverse diet in phase 3 compared to less than one-third in phase 1. Multivariate analysis indicates that the FNS strengthened the link between PFP practices and better diets in both phase 2 and phase 3, with gardening and poultry rearing more responsible for better diets than fish farming in phase 3.
Table 1: Key Estimates by Phase of Data Collection
| Indicator | Phase 1 | Phase 2 | Phase 3 |
|---|---|---|---|
| Knowledge of Infant and Young Child Feeding | |||
| Knowledge of Dietary Diversity | |||
| Sanitation and Hygiene Practices | |||
| Food Production Practices | |||
| Outcome Indicators | |||
| Baby to breast < 1 hour after birth | 53% | 83% | 89% |
| Only breastmilk for new infant | 81% | 99% | 99% |
| Exclusive breastfeeding for 6 months | 71% | 99% | 98% |
| Start complementary feeding at 6 months | 61% | 39% | 82% |
| Promoted foods (nutrient rich) | 86% | 99% | 100% |
| Ways to prevent anemia during pregnancy | 70% | 98% | 98% |
| Health problems from too little iodine | 20% | 73% | 88% |
| Improved toilet facility | 32% | 45% | 41% |
| Handwashing before preparing food | 11% | 61% | 50% |
| Handwashing before feeding child | 15% | 75% | 73% |
| Handwashing before eating | 8% | 63% | 57% |
| Handwashing after cleaning child's bottom | 72% | 97% | 98% |
| Growing vegetables in homestead garden | 43% | 95% | 86% |
| Mean number of vegetables grown | 0.60 | 2.83 | 2.45 |
| Household rearing poultry | 75% | 87% | 92% |
| Mean number of poultry reared | 7.87 | 12.01 | 12.97 |
| Household culturing fish in the pond | 48% | 67% | 63% |
| Mean dietary diversity of women | 3.90 | 6.00 | 5.62 |
Chapter 1 Introduction
SPRING is a seven-year project funded by the U.S. Agency for International Development (USAID) to provide state-of-the-art technical support and facilitate country-led, regional, and global programs to improve the nutritional status of women and children. The SPRING implementation team consists of JSI Research & Training Institute, Inc. (JSI), Helen Keller International (HKI), the International Food Policy Research Institute (IFPRI), Save the Children, and The Manoff Group. SPRING is implemented to strengthen the evidence base and to build on, clarify, and strengthen the understanding, application, and use of the most promising nutrition-sensitive interventions focusing on the 1,000-day period from pregnancy through the child's first two years of life. The right nutrition during this critical period has a large impact on a child's ability to grow and learn.
SPRING Activities in Bangladesh1
SPRING/Bangladesh focuses on the 1,000-days approach, promoting the Essential Nutrition and Hygiene Actions (ENA/EHA) by pregnant and lactating women (PLW) and children under the age of two years. We have been working in Bangladesh since 2012, using a multichannel, integrated approach for tackling malnutrition along the coastal belt of Bangladesh with both nutrition-specific and nutrition-sensitive interventions. With the ENA and EHA as the technical foundation of our work, we have worked to develop a variety of interventions, based on existing evidence-based approaches, to tackle malnutrition, with a particular focus on the first 1,000 days of life. SPRING targets PLW and their children as our primary audience, though we have also worked with husbands and other family and community members. We are working in 40 upazilas in the Barisal and Khulna divisions. By the end of October 2016, we had trained 126,255 women to improve household agriculture, hygiene, and nutrition through 6,421 farmer nutrition schools (SPRING 2016).
Farmer nutrition schools (FNS) are a nine-month training activity based on the farmer field school approach originally pioneered by the Food and Agriculture Organization (FAO) and the Danish International Development Agency (DANIDA), and which also borrows from and is influenced by the homestead food production model of HKI. Through this approach to group-based learning, SPRING incorporates the promotion and support of the ENA and the EHA into each session of the food production training modules on vegetable gardening, poultry rearing, and fish production. FNS target resource-poor households with PLW and women with children under the age of two. Each session incorporates ENA and EHA to encourage families to adopt improved practices in health and nutrition as well as homestead food production. Through messages based on "small do-able actions," FNS participants received adequate knowledge to link their promoted food production (PFP) with improved nutrition and hygiene practices. Sessions covered under these three modules are listed below:
- Module 1: Vegetable Gardening
- Homestead Space Planning and Vegetable Bed and Pit Preparation
- Sowing Seeds and Planting Seedlings in the Bed and Pit
- Crop Cultivation Operations, Soil Health Management, and Compost/Manure Preparation
- Integrated Pest Management
- Seed Production, Collection, and Storage
- Essential Nutrition Actions and Essential Hygiene Actions
- Module 2: Native Chicken Rearing
- Basic Techniques for Local Chicken Rearing
- Improved Housing and Laying Hen Management
- Broody Hen Management
- Chick Rearing Management Session
- Health Management and Egg or Meat Consumption
- Essential Nutrition Actions and Essential Hygiene Actions
- Module 3: Pond-Fish Culture
- Understanding Improved Fish Culture Techniques
- Preparing the Pond for Fish Stocking
- Fingerling Transportation and Stocking
- Supplementary Feeding, Pond Fertilization, and Liming
- Health and Growth Management and Fish Harvesting
- Essential Nutrition Actions and Essential Hygiene Actions
Objectives of the Study
The objective of this study was to determine the degree to which women participating in FNS adopt high-impact nutrition practices as well as the extent to which participants sustain these practices during the year following graduation from the FNS. Secondarily, we examined the extent to which attendance in the FNS is related to adoption of recommended behaviors. In this cohort study, we assessed improvement in the following areas:
- Individual program elements
- Homestead gardening
- Rearing poultry
- Culturing fish in pond
- Handwashing practices
- Nutrition knowledge
- Cross-cutting outcome indicators
- Dietary diversity of women
Chapter 2 Methodology
To measure changes plausibly brought about by the FNS program when implemented at scale, this study focused on one cohort of women who received the FNS curriculum in the training session that began in November 2014. The study collected data from a cohort of 440 women enrolled in 44 FNS and interviewed participant women three times: 1) before the beginning of FNS sessions (phase 1); 2) immediately after the FNS sessions were completed (phase 2); and 3) one year after the completion of FNS activities (phase 3). This report refers to these three periods as "phases." The quantitative survey tool included household sociodemographic characteristics, homestead food production, poultry, fish, hygiene, dietary diversity of PLW, breastfeeding and complementary feeding practices for children, and health and nutrition.
Sampling Strategy
During the fiscal year 2014 cycle, SPRING/Bangladesh enrolled 48,000 women into 2,560 FNS. As it would not be feasible to collect a random sample of women enrolled in these sites, we decided to undertake a two-stage sampling design in which we sampled a given number of FNS sites and selected a given number of women per FNS for interview. The study estimated the target sample size in order to obtain representative estimates for indicators of women's dietary diversity and vitamin A knowledge, as follows:
- Mean women's dietary diversity score on the nine-item FANTA/FAO scale (Arimond et al. 2009; Kennedy, Ballard, and Dop 2011).
- Mean score on a test of basic vitamin A knowledge score among women
We calculated the estimated required sample size separately for each indicator (Table 2) and the estimate for the most demanding indicator (i.e., largest sample size) was chosen for the survey. In doing so, we ensured that the anticipated sample size requirements of all other indicators were satisfied. The following formula was used to calculate the sample size for each indicator (Magnani 1997):
![Formula n=[1+delta(c-1)x[(Z sub alpha + Z sub Beta)squared x (sd1squared + sd2squared)/(x2-x1)squared)]
Where:
N=required minimum sample size
delta=the intercluster correlation
C=the number of households sampled in each farmer nutrition school
X1=the estimated level of an indicator currently
X2=the expected level of the indicator at some future date
sd1 & sd2=expected standard deviations for the indicator in the respective survey rounds being compared
Zalpha=the z-score corresponding to the degree of confidence with which it is desired to be able to conclude that an observed change of size (x2- x1) would not have occurred by chance (-the level of statistical significance), and
ZBeta= the z-score corresponding to the degree of confidence with which it is desired to be certain of detecting a change of size (x2- x1) if one actually occurred (Beta - statistical power)](/sites/default/files/publications/reports/images/fnscohort_formula.jpg)
We calculated the sample size based on mean and standard deviation estimates drawn from the James P. Grant School of Public Health/HKI Food Security and Nutrition Surveillance Program (FSNSP) and the Feed the Future monitoring data set. In estimating the sample size, a power of 80 percent and confidence interval of 95 percent were assumed. Sample sizes are sufficient to measure a 0.25 effect size in dietary diversity scores and a 0.4 effect size difference in knowledge levels. These changes are in line with SPRING's goals. The estimated sample size for each indicator was inflated to account for the cluster design of the survey using intercluster correlation coefficients (ICCs) calculated from the FSNSP data by using the loneway command in Stata (13.1). This ICC was converted to a design effect based on a cluster size of 10 women, the number of women who could be interviewed in one day.
The indicator that required the largest sample size was the vitamin A knowledge score, with a required sample size of 361 women. After inflating this number by 20 percent to account for nonresponse over the two-year follow-up period and/or small FNS where the sample would remain incomplete, 434 women were required to provide precise estimates of all the indicators to be assessed in the baseline survey. Therefore, the estimated sample size was rounded up to 440, as 10 women would be selected from each of the FNS involved in the survey.
Table 2: Estimated Sample Size
| Indicator | Current Estimated Mean | Future Estimated Mean | Desired Sample | ICCa | Design Effect | Required Sample | Required Sample with Non-exposure |
|---|---|---|---|---|---|---|---|
| Dietary diversity | 4 | 4.40 | 222 | 0.05 | 1.45 | 322 | 387 |
| Knowledgea | 1.05 | 1.27 | 95 | 0.310 | 3.79 | 361 | 434 |
a Basic vitamin A knowledge score.
Sample Selection
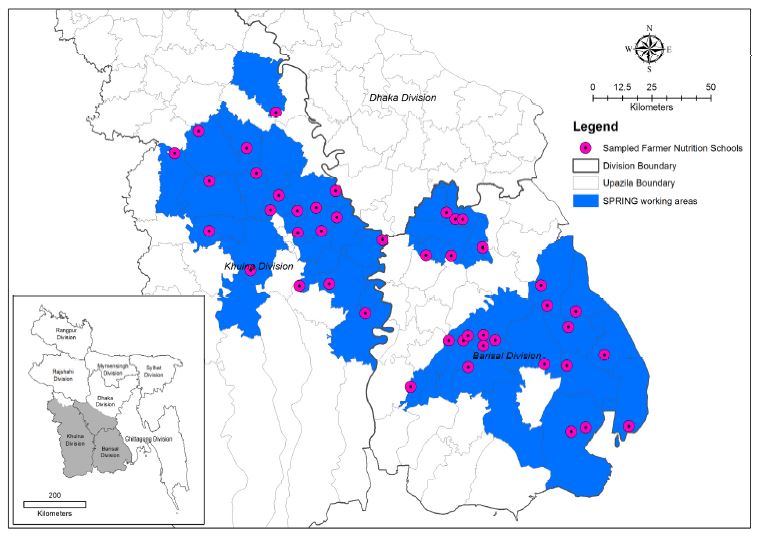
As mentioned in the introduction to this chapter, this study used a two-stage sampling strategy. In the first stage, the FNS sites were randomly sorted and 44 FNS were selected from the 2,560 FNS that were about to start. This resulted in the selection of 24 FNS from 19 upazilas in Barisal division and 20 from FNS from 19 upazilas in Khulna division. These FNS sites are depicted in Figure 1. The second stage of sampling took place in the field. When the data collector arrived at the FNS site on the day of interview, he/she listed the 16–20 women who would make up the FNS in the next cycle. The data collection officer then selected the sample for interview by listing the women in the group on paper, selecting every other woman. The data collection officer then interviewed these women in their homes or at the FNS site.
Measurement
This cohort study used standardized and internationally validated indicators to measure intervention effects whenever available. Indicators are detailed where they are presented in the report. The final questionnaire sought to measure contextual factors as well as the immediate and longer-term impacts of the SPRING FNS curriculum in eight sections: 1) sociodemographics, 2) gardening, 3) poultry management, 4) aquaculture, 5) hygiene, 6) women's dietary diversity, 7) child feeding, and 8) nutrition knowledge. The questionnaire was translated into Bangla and tested during the data collection training for the first phase of data collection in November 2014. Due to seasonal differences, the questionnaire was revised slightly before the second and third phases of the survey (completed codebooks are provided in Annex 1).
Survey Implementation
Data collection was undertaken in three phases: before the FNS training began (November 10–15, 2014); immediately after the training program concluded (July 26–August 2, 2015); and one year after the second-phase data collection (July 24–31, 2016). The interviewers recruited for this study had a week of training before going to the field for each round of data collection. The training was a combination of classroom and hands-on learning and practical exercises. All enumerators had a chance to practice using the questionnaire in an actual setting during the pretest. Ten data collectors were used in each round of data collection, with the majority of data collectors involved in all three rounds of data collection. Fieldwork was supervised by HKI and SPRING/Bangladesh staff and staff of the Research, Evaluation and Learning Team of HKI. Completed questionnaires were reviewed by SPRING staff (led by the supervisors) on a daily basis for quality control, and known errors and inconsistencies were corrected by revisiting relevant households.
Figure 1: Map of Sampled FNS in the SPRING Implementation Area
Sample Attainment
In line with the expectations built into the study's sampling strategy, some households were lost to follow-up over the course of the three-year study. During phase 1, the study interviewed 440 women, with over 93 percent (410) of the households reinterviewed in phase 2 and 91 percent (400) in phase 3. Some households did not contribute data in phase 2 but provided data in phase 3, resulting in a complete sample for 386 women surveyed in all three phases (i.e., 88 percent of households of phase 1). There were several reasons for nonparticipation in phase 2 and phase 3; the major reason for nonresponse was unavailability of respondents despite multiple attempts as they were visiting a relative's houses at the time of data collection. In addition, a few women migrated to other places and were no longer available for interviewing. A comparison between the women who were lost to follow-up and the women included in the main body of this report is provided in Annex 2.
Data Management
Phase 1 data were collected using a paper-based questionnaire and entered into a database by data entry operators using tablet computers; phase 2 and 3 data were entered directly on tablet computers in the field. The entered data were converted into Stata for cleaning, recoding, and analysis. For further analysis, enrollment and attendance information were converted from Excel to Stata *.dta format and matched to the surveyed sample.
Informed Consent and Ethics
Before starting the interview, all data collectors took written consent from respondents during the first phase and oral consent subsequently. A clear, easily understandable consent form was designed and included at the very beginning of the questionnaire. This consent form ensured that the participation of the respondents was voluntary. Interviews took place in a private area and no financial or other benefits were provided to the interviewees. The protocol was approved by JSI Research & Training Institute, Inc.'s Institutional Review Board (#14-028, dated October 29, 2014).
Statistical Analysis
Results in this report are presented using proportions for categorical variables and means for continuous variables. Data analysis was done using Stata (StataCorp, v13.0). Whenever the report mentions statistical significance in the text, the test employed was the adjusted Wald test with a 95 percent confidence interval. This test was used as all confidence intervals were estimated using "svy" command in Stata. In the final chapter of the report, we use multiple logistic regression to identify predictors of categorical outcome variables and multiple linear regression analysis to identify the predictors of continuous outcome variables.
Structure of This Report
This report is structured to outline the proximate and distal impacts of the FNS program. Throughout the report, the focus is on the sample of 386 women who were included in all three phases of the survey. The Results chapter contains three sections: 1) background characteristics, 2) practices directly related to program elements, and 3) outcome estimates of dietary change and income. For most indicators, presented results are disaggregated by division and attendance rates in FNS sessions. For indicators related to only one FNS unit, such as gardening and poultry rearing, the attendance rates shown are only for that unit. In contrast, for cross-cutting indicators that were nested in several or all units, such as hand hygiene and nutrition knowledge, results are presented over the proportion of sessions attended over all units. Attendance rates can be information for all phases of data collection as they indicate if high attendance was driven by certain practices before the FNS or resulted in better uptake of recommended practices after the FNS. Following these descriptive results is a chapter showing the multivariate summary of the characteristics related to program uptake in the second and third phases. The final chapter presents a brief discussion of the results.
Supplemental Qualitative Information
Throughout the report, we include selected quotes from a small qualitative study also carried out among FNS beneficiary women. This qualitative study was designed to supplement the quantitative cohort study by achieving the following two objectives:
- To determine which high-impact nutrition practices taught in FNS sessions that women participating in FNS adopt
- To assess what the main barriers were to sustaining positive practices
- To assess women's perception of the benefit they have received from adopting these recommended practices
We used the findings from this research to help fine-tune our approach and ensure that the ongoing support given to graduated communities is effective and leading to long-term results and sustained change. For this study, a total of 24 focus group discussions (FGDs) were conducted, eight each in three distinct locations (Khulna, Jessore, and Bhola districts). Participants were chosen from among the members of the FNS conducted in fiscal year (FY) 12, FY13, and FY14 based on their availability. Based on perceptions of the SPRING field staff, the qualitative study team sought to divide FNS graduates in each area into low and high performers. In both the high- and low-performing groups, we conducted one FGD among participants of the FY12 FNS, one FGD among the participants of the FY13 FNS, and two FGDs with the recent graduates of the FY14 FNS (see Table 3). Since the goal was to include PLW graduates with children under two in the FGD group, and this was also a criterion of FNS membership, the FY13 and FY14 cohort had more potential participants, as a result of aging effects. Data were collected directly after the FY14 FNS batch that graduated in mid-2015.
Table 3: Number and Type of FGDs in Each Area
| Khulna District | Jessore District | Bhola District | Total | ||||
|---|---|---|---|---|---|---|---|
| FNS Group | High Performers | Low Performers | High Performers | Low Performers | High Performers | Low Performers | |
| FY12 | 1 | 1 | 1 | 1 | 1 | 1 | 6 |
| FY13 | 1 | 1 | 1 | 1 | 1 | 1 | 6 |
| FY14 | 2 | 2 | 2 | 2 | 2 | 2 | 12 |
| Total | 4 | 4 | 4 | 4 | 4 | 4 | 24 |
FGDs cannot be used for population-level data, as variations in regional practices can be identified with FGDs. FGD sessions covered the topics contained in the FGD guidelines as well as any spontaneous topics that came up during the sessions. FGD facilitators intensively probed on issues such as cost, time, availability of supplies, access to supplies, support from husband/mother-in-law/father-in-law, disease/pests, natural disasters, et cetera. FGDs were tape-recorded, transcribed, and translated into English. Coding was performed using the trial version of the NVIVO software program to organize the data by theme such as homestead gardening, poultry rearing, fish farming, hygiene, and nutrition practices. Including PLW with mothers of children under two years of age at the time of the FGD was necessary in order to assess whether practices related to pregnancy and infant/young child care were being continued. The FGDs were conducted with women aged 20–35 and the majority of respondents had three to eight years of education. We have organized the findings of this study thematically and explored responses across FNS fiscal year, geographic area, and high- or low-performing group.
Strengths and Limitations
This study benefits from a relatively large sample spread across over 40 sites. The consistent elements of the survey, the panel design, a stable survey instrument, and the fact that many of the data collectors remained the same in all phases of the survey increases the power of the comparisons made across time and space. The survey instrument sought to cover all the major elements taught in the FNS modules. The timing of the study was also ideal, with phase 1 implemented before any FNS sessions began.
Significant resources were devoted to data collection, data management, and analysis. Before data collection began, the enumerators for the study were given a week-long training and sufficient oversight was provided to all teams in the field. Data management was undertaken from the original data and all data-cleaning steps are documented and reproducible. During analysis, care was taken to account for the clustering in the data and ensure that the analysis was done over a consistent population in each period. Using the FNS enrollment lists, we verified that the "matched" sample was like the sample for which complete data were not available. Notable reasons for absence from the survey in phases 2 and 3 include short-term migrations (e.g., went to father's house, relative's house, husband's house).
There are also some limitations in the study design. Most notably, this study does not contain a comparison group, so we cannot verify that the changes observed within the sample are attributable to SPRING. Due to cohort design, this study gives information about the project beneficiaries only, not on the entire population. In addition, some participants lost to follow-up (not surveyed in all three rounds) were not included in the final analysis. Additionally, the seasonal variation observed between phases 1 and 2 could have resulted in some of the observed change, especially as vitamin A–rich fruits are much more readily available during the monsoon months, when phase 2 and phase 3 data were collected. Another limitation is our inability to say much about changes in child diets and IYCF practices due to the aging in the child sample across the phases of data collection. This study may also suffer from some level of social desirability bias, as the FNS participants could have reported positive results to obtain approval from the project and the field workers. Most responses recorded during the survey were self-reported, not observed.
Chapter 3 Results
This study classified women according to their educational attainment, defined as the number of educational grades completed. For analysis purposes, the educational attainment of women was categorized into the following six groups: 1) no education, 0 years; 2) partial primary, 1–4 years; 3) complete primary, 5 years; 4) partial secondary, 6–9 years; 5) secondary school certificate (SSC)/Dakhil, 10 years; and 6) post-SSC, 11 or more years. These data were collected in all three rounds of data collection, and there were, as expected, only minor differences. Therefore, categorized educational status reported here is for phase 1 only.
The plurality of women completed partial secondary education in all areas (Figure 2). Overall, the education level in the cohort sample is similar to that among mothers as measured in FSNSP 2014, both nationally and comparing the two divisions included in SPRING; however, in the cohort sample, fewer women are in the least-and most-educated categories compared to the FSNSP sample (FSNSP: national—no education, 18 percent; post-SSC, 7 percent). The proportion of women who completed partial secondary education was significantly higher in Khulna (50 percent) than Barisal (37 percent). In both divisions, the proportion of women with no education was almost equal to the proportion of women who completed higher education (SSC/Dakhil or post-SSC). There were no significant differences between the two divisions in the proportion of women with other education categories.
Figure 2: Educational Attainment of Women (Phase 1)
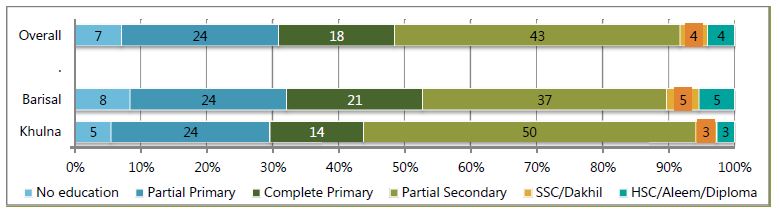
Figure 3 shows the proportion of women involved in an income-earning occupation at each data collection phase. In this study, as in the FSNSP system, involvement in an income-earning occupation includes any activities that result in household income even if that income is not received by that same individual. The proportion of women currently involved in income-earning activities increased significantly between phase 1 and phase 2 and between phase 2 and phase 3. The proportion of women earning income was similar between Khulna and Barisal in the first phase, but increased more rapidly and to a higher level in Khulna than in Barisal, though the difference was not significant. This change could have been driven by the SPRING program in either of two ways: 1) SPRING directly supports women in undertaking greater production of goods on the homestead and methods through which these items can be sold if there is a surplus; or 2) through direct training, women realize their contribution to the household income.
Figure 3: Proportion of Participants Involved in Income Earning
In contrast to the increase of women's involvement in income-earning activities, the occupations of the participants' husbands did not change dramatically, as shown in Figure 4. The increase in own farm activity and other occupations between phases 1 and 2 is likely linked to the seasonal change between phase 1 and phase 2. Between divisions, paid farmwork was practiced by a larger proportion of participants' husbands in Barisal compared to Khulna (figure not shown).
Figure 4: Distribution of Participants by Husband's Main Occupation
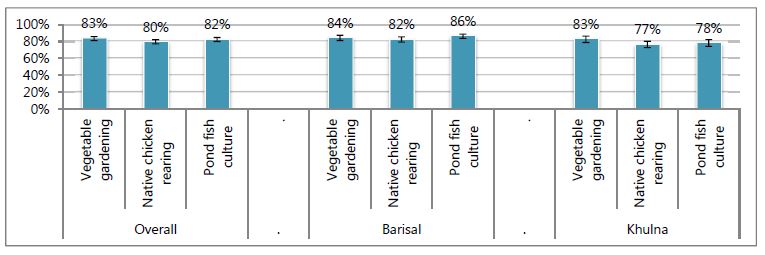
FNS attendance was generally high, with more than 80 percent of participants attending 75 percent or more of the FNS training sessions (Figure 5). Attendance was defined as the woman herself attending or another family member attending on her behalf if the woman was unable to come. However, substitute attendance was not widely practiced, with 74 percent of the 440 sampled women never having a family member attend and less than 5 percent of women with four or more sessions where her attendance was substituted by a family member. Nearly one of every three participants attended all 18 sessions (100 percent) and one-half of participants attended 14–17 (more than 75 percent) sessions. The attendance rates for Barisal and Khulna divisions were in line with the overall attendance rate, though low attendance was slightly higher in Khulna (16 percent compared to 11 percent).
Figure 5: Attendance Rate of Participants in FNS Sessions
There are also differences in attendance rates by women's education, though there was not any difference by income-earning status (Figure 6). A greater proportion attended less than 7 percent of sessions among women who had received no education and those with SSC or higher degrees, compared to women with moderate educational levels. Figure 7 indicates that attendance was equally high for all units of the FNS (see the Methods section for more information on the contents of these units). More than four-fifths of women attended five or six sessions of each unit's six sessions. In line with Figure 6, the attendance rates in Khulna were slightly lower than in Barisal, with only a little over three-fourths of women with high attendance at the poultry and aquaculture units of the FNS.
Figure 6: Attendance Rate of Participants in FNS Sessions by Educational and Income-earning Status
Figure 7: Proportion of Participants Who Attended Greater than Two-thirds of a Unit's Sessions
Program Elements
We sought to increase nutrition knowledge while changing behavior around household hygiene, homestead gardening, native poultry rearing, and fish culture in ponds. In this section, we will review indicators measuring knowledge in each of these topics. To better understand the interrelation of the FNS sessions' impact on behavior change, all indicators will be presented by attendance rate of women as well as the division of residence. As nutrition knowledge and household hygiene are cross-cutting issues, these will be presented against overall attendance rates, while gardening, poultry rearing, and aquaculture will be presented by the six sessions with that topic.
Health and Nutrition Knowledge
Knowledge of nutrition, in terms of both IYCF practices and key information on dietary diversity and micronutrients, is important for improving nutrition behavior. The amount of general nutrition knowledge among FGD participants was rated high by qualitative interviewers. During the FGD conversation, participants were able to discuss leafy green vegetables, colorful fruits, eggs, meat, small and big fish, thick pulses, sweet pumpkin, bananas, and chickens as nutritious foods. Most of the women knew about the energy and nutrient needs of women during pregnancy and lactation. Participants also mentioned the need to take iron and folic acid tablets, but these tablets were not well liked by participants due to taste and constipation effects, stating, "This tablet needs to be taken every 1–2 days to avoid this problem." Participants also noted the need for a vitamin-A capsule after delivery. They also mentioned the importance of eating nutrient-rich foods, such as eggs.
FNS graduates understood the importance of breastfeeding. Participants mentioned a number of important facts, such as that, when breastfeeding is initiated early, the baby gets colostrum, and that early initiation of breastfeeding helps the uterus to return to its normal size, helps to expel the placenta, and can help reduce postpartum bleeding. One participant even mentioned that the risk of breast cancer can be reduced by breastfeeding. There were also savings associated with breastfeeding over bottle-feeding the baby because of the expense of processed milks and powders. The women reported that the days when newborn babies were first fed honey or sugar water "are over." They understood that exclusive breastfeeding also protects the child from illness and had information about proper breastfeeding techniques and the importance of feeding on demand. They understood that the first breastmilk contains more water and that, later, a thick milk comes out, which gives more energy to the child and makes them healthier. They said, "If the main milk remains in the breast, then the baby can have a nutrient deficiency."
Participants knew to start complementary food after six months, as the child needs extra food, besides breastmilk, at this time. Some participants could state the amount and frequency of complementary feeding but many, particularly among the low performers, could not. All participants noted the importance of diversified foods for infants and young children. They remarked that is it easier to meet these needs now as they can produce food at their homes: "Now we can consume eggs almost daily and it would not be possible for us if we had to buy them. Our children can eat eggs every day." With regard to healthy snacks, participants repeatedly mentioned options such as seasonal fruits (banana, ripe papaya, and guava), boiled eggs, potatoes, noodles, and homemade cake. When their children were recovering from an illness, they reported taking extra care and giving frequent food, whatever they felt was needed to make up the nutrition deficiency.
In the quantitative survey, the knowledge module captured some key indicators related to child feeding, maternal anemia, vitamin-rich foods, and health problems due to iodine deficiency. The study questionnaire covered four questions on IYCF: 1) knowledge of the correct time to begin breastfeeding; 2) information on the first food that a child should be given after birth; 3) duration of exclusive breastfeeding; and 4) time at which complementary foods should be introduced to the child. The study questionnaire covered three questions on general nutrition knowledge: 1) which foods are nutrient dense; 2) how to prevent anemia; and 3) results of iodine deficiency. These questions were the same in all rounds of data collection.
IYCF Knowledge
Early breastfeeding behaviors, the topic of the first two knowledge questions, are essential to provide infants the nutrients they need while preventing early infections and illness. Needing no preparation, breastmilk is hygienic even in low-resource settings, and protective factors in milk help to ward off infections (Dewey et al. 2001; Krebs 2000; WHO/UNICEF 2010), greatly improving child survival (Fischer Walker 2012). The "early initiation of breastfeeding," defined as providing breastmilk to the infant within one hour of birth, is promoted by the Government of Bangladesh and the World Health Organization. "Prelacteal feeding" refers to the practice of feeding an infant anything other than breastmilk during the first three days after birth, and is often undertaken due to traditional beliefs around breastmilk not "coming down" for several days after birth or the need to give ceremonial foods before breastfeeding. Prelacteal feeding is discouraged as it can introduce the child to pathogens and negatively impact breastfeeding.
In light of the importance of these practices, women were asked when a child should be put to the breast after birth and what should be fed to the child first. A woman was judged to have answered the early initiation to breastfeeding question correctly if she said without any outside influence that a newborn should be put to the breast immediately or within one hour after his/her birth. Similarly, a woman was judged to have answered correctly regarding what a child should consume after birth if she responded that children should receive only breastmilk and/or colostrum right after birth.
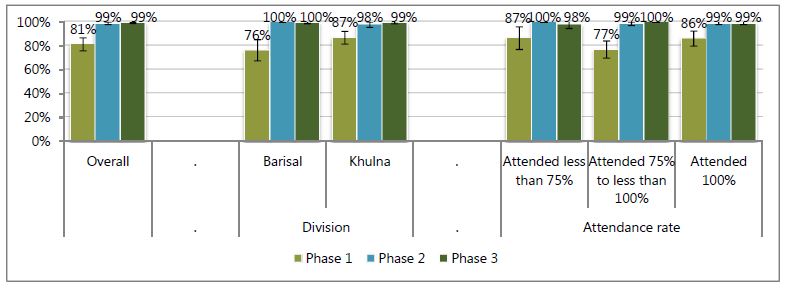
The proportion of women who had knowledge about putting the child to the breast after birth increased from 53 percent before training to 83 percent in phase 2 and 89 percent in phase 3 (Figure 8). Between divisions, the women's knowledge was greater in Khulna than in Barisal in phase 1, but roughly the same in both divisions in phases 2 and 3. In addition, there were no major differences in message uptake by attendance rate, nor did women who already knew the correct responses attend sessions more or less often than women who did not. More women in all phases knew that colostrum or breastmilk should be the first food for infants (Figure 9). Overall, over 80 percent knew this in phase 1; this proportion increased to nearly 100 percent in phases 2 and 3. By division, knowledge was again higher in Khulna in phase 1, but not different between the two divisions in subsequent phases. Similarly, there were no major differences in message uptake by attendance rate.
Figure 8: Correctly Answered That Babies Should Be Breastfed within One Hour of Birth
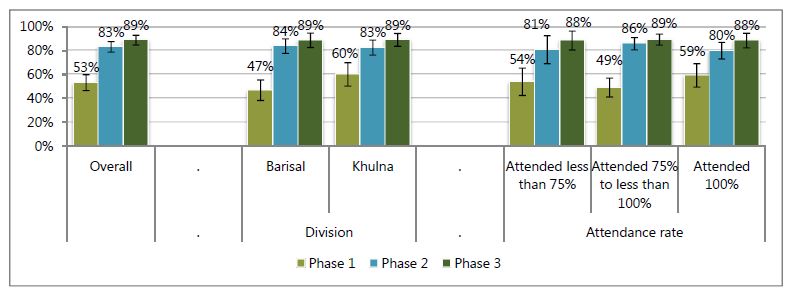
Figure 9: Correctly Answered That Child Should Receive Only Breastmilk/Colostrum Immediately after Birth
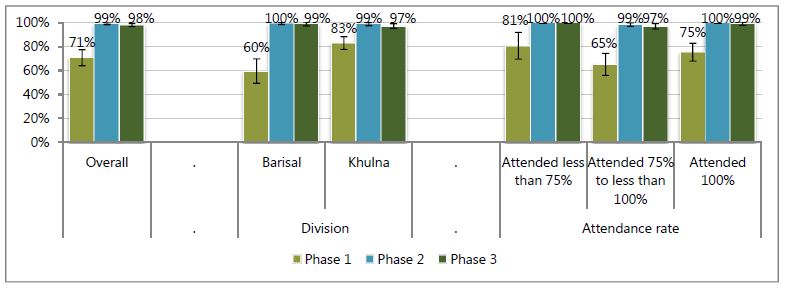
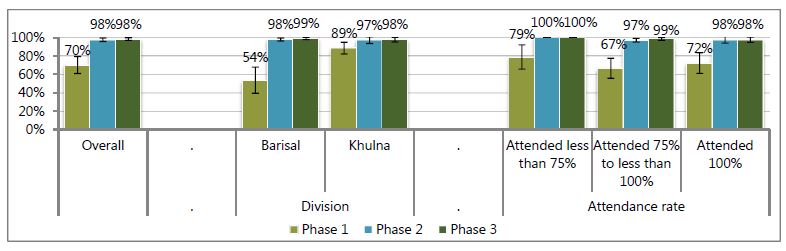
The next two questions cover the transition from exclusive breastfeeding in early infancy to breastfeeding accompanied with family foods at six months of age. For infants less than six months of age, exclusive breastfeeding is the only recommended feeding practice (Black et al. 2008). Exclusive breastfeeding, feeding nothing but breastmilk and required medicines, provides all nutrients required for healthy growth until six months of age while protecting infants from food-based pathogens. At six months of age, there is a transition from exclusive breastfeeding to breastmilk complemented with semisolid and solid foods, referred to as complementary feeding. Complementary feeds are required because breastmilk has a limited amount of some vital nutrients, and an infant's stores of these nutrients are often exhausted by six months of age (WHO/UNICEF 1998; Dewey et al. 2001; Krebs 2000). For these two questions, the woman was scored as knowing the correct answer when she indicated that exclusive breastfeeding should end and complementary feeding start at exactly six months.
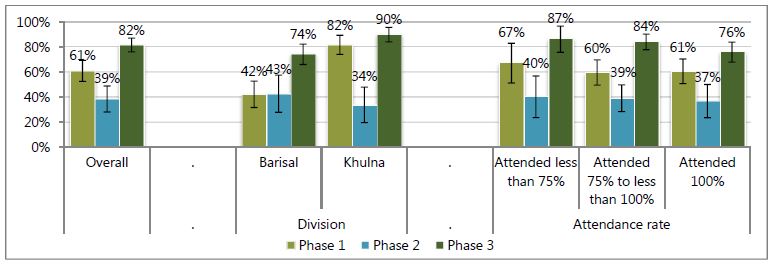
Before attending the FNS, nearly three-fourths of women correctly reported the time at which exclusive breastfeeding should end, though the proportion of women with correct responses significantly increased to 100 percent at the end of the FNS training (Figure 10). As with all other indicators, knowledge was higher in Khulna before the FNS began than in Barisal and FNS session attendance was not associated with knowledge of the correct practices after the FNS.
Figure 10: Correctly Answered That a Child Should Be Exclusively Breastfed for Six Months
The pattern of knowledge attainment for the correct time to start complementary feeding was somewhat different. As with other indicators, before beginning the FNS, a greater proposition of women in Khulna knew the correct time to start complementary feeding compared to Barisal; however, the proportion of women answering this question correctly fell during the second phase. During this phase, most women answered seven months. Interestingly, the women who attended the fewest number of sessions seemed to have attained the most knowledge by phase 3 (Figure 11).
Figure 11: Correctly Answered That Child Should Start Eating Family Foods at Six Months of Age
General Nutrition Knowledge
Anemia during pregnancy is one of the major health problems in Bangladesh, and maternal anemia is a cause of maternal mortality. In this study, women were marked as knowing how to prevent anemia in pregnancy if they could mention any of the following means: eating iron-rich food/meat/dal, taking iron/multivitamin supplements, eating kochu shak/green leafy vegetables, or taking deworming medicine. Almost three-fourths of women could state a way to prevent anemia before the FNS began, but this increased to almost all women by the second phase. Similar to other indicators, baseline knowledge was higher in Khulna compared to Barisal and all attendance groups increased their knowledge (Figure 12).
Figure 12: Correctly States at Least One Way to Prevent Anemia during Pregnancy
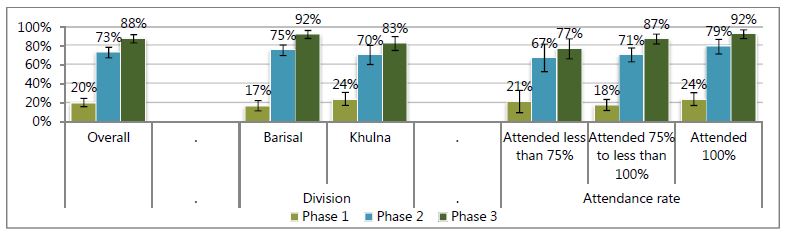
Women's knowledge about iodine was assessed by asking them to name one health problem or disease that may result from too little iodine intake (Figure 13). A list of possible problems like goiter and mental slowness were included in the questionnaire. A woman who correctly mentioned at least one health problem/disease due to deficient iodine, even if not a precoded option, was considered to have appropriate knowledge. This question, by far, had the lowest proportion of women who knew the correct answer to this question during phase 1, at merely one-fifth. This proportion increased to nearly three-fourths by the end of the FNS and continued to increase to nearly nine-tenths by phase 3. Similar to all other indicators, phase 1 knowledge was greater in Khulna than in Barisal; in phase 2 and phase 3, knowledge was slightly, but not significantly, higher in Barisal. This knowledge indicator is also the first one that shows a greater increase in knowledge for women who attended more sessions.
Figure 13: Can Correctly State at Least One Health Problem That Results from Too Little Iodine Intake
Handwashing
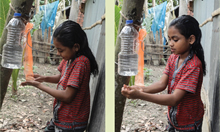
Appropriate handwashing practices are one of the key cost-effective strategies in keeping the family, particularly children, safe from waterborne diseases (Fischer Walker et al. 2012). Improvement in handwashing practices impedes infections and protects them from malnutrition and death. Unfortunately, handwashing practices are very poor in Bangladesh, particularly in rural settings (icddr,b, et al. 2014). As a consequence, SPRING FNS includes messages on handwashing practices in multiple modules to let participants better understand the need for handwashing practices, and incorporates key messages on optimal handwashing practices throughout the 18 training sessions.
Nearly every FGD participant reported cleaning their hands after defecation, after handling dirty things, after cleaning the feces of children, before eating, before serving food, and after handling domestic animals. Participants mentioned that this protects them from disease: "We have to practice this behavior if we want to live free from diseases." The participants were also able to mention the six handwashing steps promoted by SPRING. Many participants also maintained a handwashing station, but maintenance of the SPRING-recommended tippytap was mixed. Most knew how to make a tippy tap and most had access to soap. Children playing with the tippy tap was seen as a nuisance. Handwashing stations, mostly tippy taps, were placed next to the kitchen and beside the bathroom/toilet. Households could generally manage the maintenance of tippy taps: "We need to clean the bottle or change the bottle after a few weeks and regularly put fresh water in it." Tippy taps were seen as convenient when maintained properly: "Now (we) don't need to go far away for handwashing, especially during the rainy season."
Participants reported various benefits from handwashing, including fewer cases of illness: "We decrease diarrhea by the using tippy tap and washing our hands regularly. We don't buy so much saline these days." They also mentioned that handwashing needs to become a habit for all: "If one member of the family follows a [useful] practice, then the rest of the [family] members also follow that." Some participants even reported other households starting to use this new technology (the tippy tap): "Though sometimes it's difficult to collect a bottle, most of the family members like this system. Our neighbors are also following this system. Even people who are not using a tippy tap use [a] tube well or tub and mug with hanging soap beside it." It seems that regardless of type of handwashing station used, community members exposed to the FNS curriculum are washing their hands more and are able to see the benefits from doing this.
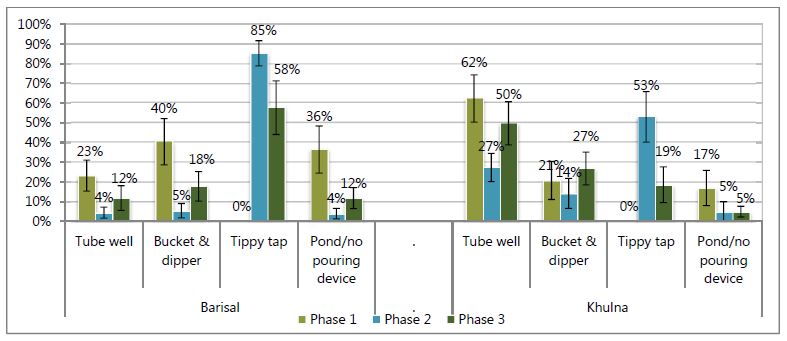
A handwashing station consisting of water, a pouring device, and soap or detergent is a vital prerequisite for washing hands frequently. We also directly promote the tippy tap device for establishing a handwashing station in all households. In the quantitative study, while we did not ask about soap availability during the first phase of data collection, we did collect information on the most frequently used type of handwashing station in each phase (Figure 14). Overall, the proportion of households using a pond or no pouring device fell greatly between phases 1 and 2, before increasing slightly between phases 2 and 3 overall and in Barisal (Figures 14 and 15). The majority of households used a tippy tap as their main handwashing station during phase 2 (70 percent), but this proportion fell to only a plurality by phase 3 (39 percent), with many households again using tube wells or buckets with dippers as the main handwashing source. Interestingly, the uptake of tippy taps for handwashing was lower in Khulna, where the use of tube wells was more common.
Figure 14: Types of Primary Handwashing Stations Used (with or without Soap)
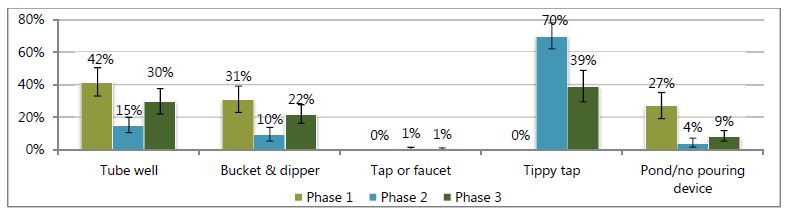
Figure 15: Types of Primary Handwashing Stations Used by Division (with or without Soap)
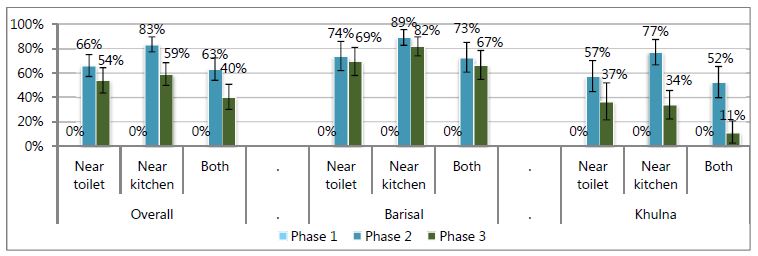
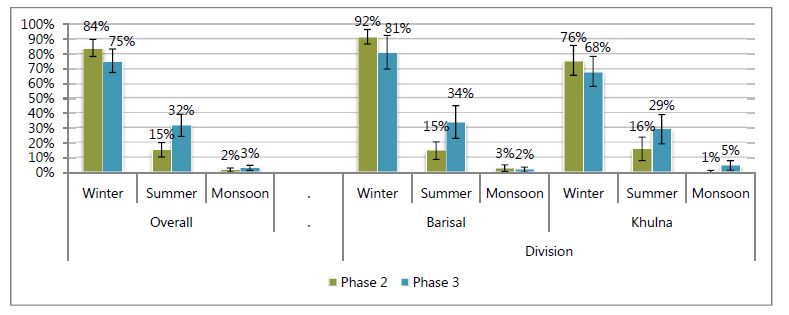
Though tippy taps were no longer the main handwashing location for many households by one year after the FNS curriculum, they were still commonly found in households as a second or third handwashing space (Figure 16). At the start of the project, tippy taps were not found in any surveyed households, but 90 percent had set up at least one tippy tap by the end of the FNS sessions (Figure 19). By one year after the sessions ended, two-thirds of households still had a tippy tap device at their household; however, the proportion of households maintaining tippy taps was much higher in Barisal (82 percent) than Khulna (49 percent). While we found little correlation between attendance and having a tippy tap at the end of the FNS sessions, maintaining the tippy tap was higher among households where attendance was sustained for all sessions.
We recommended that these devices be placed at two locations at each homestead: near the kitchen and near the toilet facility (Figure 17). Many households followed these recommendations and placed more than one tippy tap at their homestead. A greater proportion of households put the tippy tap near the kitchen than near the toilet. Overall, over three-fifths of households had a tippy tap in both locations at the end of the FNS, a proportion that fell to two-fifths during the year following the FNS sessions. Retention of tippy taps in both locations was significantly higher in Barisal than in Khulna.
Figure 16: Proportion of Households with at Least One Tippy Tap
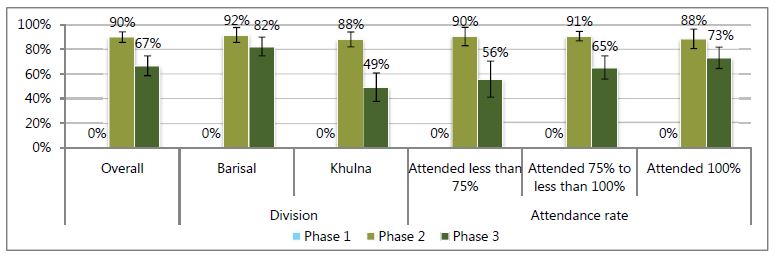
Figure 17: Proportion of Households with a Tippy Tap in the Given Location
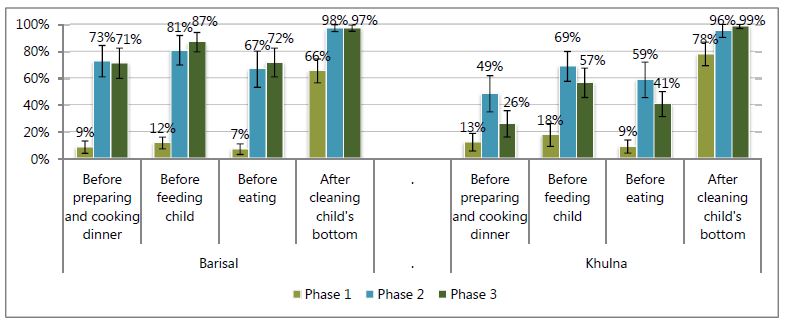
This study collected information on the handwashing practices of the FNS women at critical points: before preparing food; before feeding the child; before eating; and after cleaning the child's bottom (after defecation). Women who reported washing their hands in these situations were asked whether they used any cleansing agents (e.g., soap, detergent) with water to wash their hands. Appropriate handwashing was defined as women who reported washing both hands with water and a cleansing agent.
Handwashing practices improved drastically after the end of the FNS, in phases 2 and 3, a significantly greater proportion of women washed hands at critical junctures (Figure 18). Overall, one year after the completion of the FNS the rates of reported handwashing remained high but were slightly lower than in phase 2. A similar pattern was seen in both divisions (Figure 19); however, the decline in handwashing practices was seen only in Khulna, while reported handwashing continued to rise in Barisal. There were no major relationships between session attendance and handwashing practices (figure not shown).
Figure 18: Proportion of Women Who Reported Washing Hands at Critical Juncture Using Soap and Water
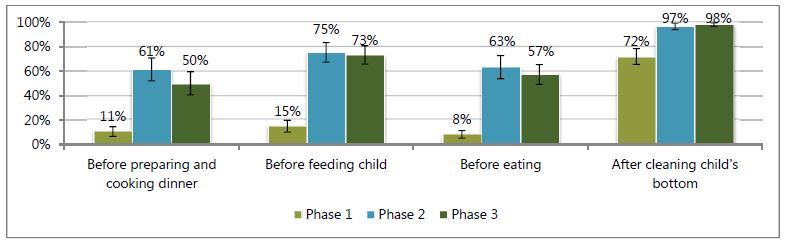
Figure 19: Women Who Reported Washing Hands at Critical Juncture Using Soap and Water by Division
Homestead Gardening
Growing vegetables in the homestead is the first production topic covered in the FNS sessions. Bangladeshis are accustomed to cultivating vegetables near their houses and the majority of respondents had experience with homestead gardening before the FNS intervention. However, some respondents reported that they started gardening only after they received the training: "After getting the training from FNS, we started gardening at our homestead and benefitted greatly." In addition, respondents reported that the FNS intervention improved the production techniques they used: "Now we know the right techniques of cultivation and can consume vegetables all year round. Also, seeds do not get damaged by animals and children because of the bed and pit techniques." These improved techniques enabled easier access to vegetables for sale and for the home, benefiting their families: "After we got the training and learned the techniques, we are now getting more vegetables with proper nutrition and free of toxins, and healthier than those in the market." In the context of contributing to family income, food production provides food security and an income source for women: "Now we get vegetables all year round and don't have to worry about consumption. We can eat well and can also sell the vegetables now." These benefits led to a determination to continue gardening: "We will continue this practice for our improvement because by cultivating now we can eat different types of vegetables daily, which was not possible for us before as we are poor. By cultivating using bed and pit techniques now we can easily produce many vegetables and weeding out easily so production has increased and we can sell them. In addition, we get nutrition and vitamins from our own garden which is also toxin-free. Our family members also now help us, especially husbands—they spade the soil because it saves money and also we don't have to go to market frequently."
Interestingly, between the high- and low-performing groups, low performers were more concerned about earning money by selling vegetables than consuming them for health benefits, and also about saving money, whereas high performers were concerned about health issues, preferring to consume home-produced vegetables rather than sell them, as in this way they could also save money. There were also regional differences; the gardens in Bhola and Jessore had greater production than Khulna, which was reported to be lower because of high levels of salinity. Participants from these areas had comparatively more space for gardens and their land was more fertile. However, both high and low performers across fiscal years and areas stated that they learned from the training: "Now we started cultivating using the bed and pit system after we got the training, but before that we didn't have any idea about these kinds of techniques. Moreover, now we also sow the seeds properly so our seeds and seedlings do not get spoiled like before. Earlier, we just used to spread the seeds over the soil so that seedlings did not grow properly and animals also destroyed the seeds, but now we also learned to use a net fence." Fertilization was a skill mentioned by participants: "Now we use organic fertilizer and pesticide, which increases the amount of production. In addition, it makes vegetables taste better and healthier as well as making the soil more fertile." In addition, another woman mentioned: "Pesticides are now made at home so our expenses have also decreased in [a way] that we weren't aware about previously." Among FNS participants, some households cultivated vegetables commercially and reported having learned less from the trainings: "The techniques are not new to us but we do not practice these in the household level because our husbands are involved with commercial vegetable cultivation and they know these techniques."
Gardening techniques learned also enabled FNS graduates to overcome natural hardships: "Prior to cultivating using the bed system, rain used to cause waterlogging in the garden and water couldn't flow out, so our plants died. Now, using the bed system there is a gap between each row, so now water can flow out easily and plants' roots do not get damaged." Another woman mentioned: "Now, even in heavy rainfall, we know to cover the garden with polythene so excessive water can't enter the garden. We learned this new technique from FNS." Livestock destruction of gardens was also reduced: "Earlier, animals, particularly goats and hens, destroyed our garden but now they do not because now we establish fences around the garden, which helps to protect the garden." However, natural hardships still reduced production: "Tidal water enters our house so we can't cultivate anything and in the rainy season it is difficult to find a safe place for us because the house goes underwater. In other seasons, though, we try to cultivate vegetables in a pit."
Participants in the FGDs were able to explain proper production processes such as an improved way to cultivate seeds and seedlings: "We sow the seeds using a bed and pit system and now we just plant two to three seeds, not more than that, because through this process seedlings grow nicely, not poorly like before. Now, after preparing the soil, we mix the upper and bottom soil with organic fertilizer and sow the seeds. In a bed, we spread the seeds in different rows and keep a one-hand gap between rows so that our seeds do not get damaged and we can get healthy seedlings." The women see these practices as useful: "By following these techniques we are getting healthy plants and also seeing plants grow from the seeds."
The use of organic fertilizer has increased among the respondents: "After getting the training from FNS now we can use organic fertilizer rather than chemical fertilizer because it increases the growth of vegetables and helps us consume chemical-free, fresh and harmless vegetables. Nevertheless, now we can make the fertilizer ourselves at home, which saves our money." Those who used organic fertilizers said their vegetables tasted better and that the organic fertilizers were better for soil health compared to those who used chemical fertilizers: "Vegetables which are produced using organic fertilizer are very tasty to eat whereas vegetables grown using chemical fertilizers taste bitter. Besides, organic fertilizer is good and makes soil fertile." Respondents also perceived health impacts: "Organic fertilizer contains vitamins so in that way it's very good for health and it increases our immunity, which makes us healthy. On the other hand, chemical fertilizers are harmful for our body and can give us different diseases. However, organic fertilizer also reduces the chances of disease." Many households also used a hybrid system of organic and chemical fertilizers: "Generally we use organic fertilizer during soil preparation because it increases soil capacity to support growth, but when seeds are started and become plants, we use chemical fertilizers, like TSP and phosphate, during that period because plants sometimes grow thin and chemical fertilizers help them to grow faster and bigger."
Natural pesticides are used broadly among the respondents, and respondents could name many common systems of natural pest control, such as neem leaves, ash, tobacco leaves, mahogany fruits, pheromone trap, detergent, kerosene oil, foamy soapy water, and red chili powder. Selective culling of plants was also noted: "Sometimes we remove insects by cutting the affected part of the plants so that the entire plant doesn't get attacked by insects." Some respondents in the high-performing group could also outline in detail which treatment was best for which pest: "To remove the insects of vegetables we use rotten pumpkin and for that first we put some rotten ripe pumpkin into coconut hard scull and keep it in a higher place in the homestead garden. The smell entices insects to come and eat it; then they die. We also use red chili powder or ash as pesticide and apply that with date trees' leaves." The bed system also assisted in pest control: "Insects can easily be removed from the bed system cultivation because plants are grown separately in different beds so we can detect them quickly. It saves our money and is good for health."
Natural pesticides were seen as advantageous because of cost and health considerations: "Knowledge of making pesticides at home helps us very much because it saves money. Available materials are used as pesticides and we don't need any support from anyone for buying pesticide from market. In addition, market pesticides are very poisonous and harmful for the human body. Our homemade pesticides, however, are not poisonous and through them we are getting fresh vegetables." There were also perceptions that the chemicals in pesticides can negatively impact nutrition: "Market pesticides destroy the vitamins of vegetables and it's very harmful for a child's health."
Some respondents still relied on commercial pesticides: "We use market pesticides in our homestead gardens because our husbands are involved with commercial cultivation of vegetables, so we can get pesticides from them as they use them in their field crops. Also, when we need them, our husbands can bring the spray machine from the field and all of our neighbors can share it with each other." Sometimes the reliance on pesticides resulted from a failure of the natural systems: "Only cow dung or ash can't remove all the insects, so we need market pesticides because they work quickly, though for that some money has to be spent."
Seed storage practices also changed in response to FNS trainings. Methods of selection were refined: "During the collection of seeds, now we select the fruits that take an average amount of time and also look at the size, maturity, and skin color of vegetables. After that, we dry them in the sun. We keep the plants wrapped with cloth, polythene, or plastic packet or keep them in an airtight bottle." Methods of storage were improved: "We preserve the seeds with dried neem leaves in an airtight pot." Improved storage techniques have had financial benefits: "Now we can save our money by storing seeds and can get good quality seeds." There was also some report of social support among FNS participants: "Heavy rainfall damaged the planted seeds and we also don't get enough seeds from SPRING so sometimes we face problems and when that happens, we can collect seeds from our neighbors."
Gardening was reported to increase access to food: "We can save money from cultivating vegetables, so we don't have to buy [them] from the market. At cooking time, we don't have to wait for our husbands to buy food from the market." The location of the garden near the home was seen as a benefit: "It is very convenient to cultivate vegetables because it's in our house yard, so we can look after it easily and don't have to go outside [the homestead]. Furthermore, now we know the techniques of producing different types of vegetables in a small space." Consumption of vegetables was also seen as linked to better health: "By consuming homestead produced vegetables, diarrhea and gastric problems decreased because we don't use poisonous pesticides."
Respondents noted that neighbors were interested in the techniques that they learned at the FNS: "Many of our neighbors and relatives follow the bed and pit techniques like ours because they see that we are getting lots of and different types of vegetables from our garden. Additionally, we can eat these and some of us also sell the vegetables. So our neighbors are following our techniques, and interestingly some of our neighbors often ask us and come to us to know about pesticides and organic fertilizers, and we also told them that we now feel better that we know something." Additionally, neighbors are interested in local purchase: "Now many of our neighbors regularly buy vegetables from us because they know that we don't use harmful pesticides and fertilizers. Also, our produced vegetables taste different than the market ones."
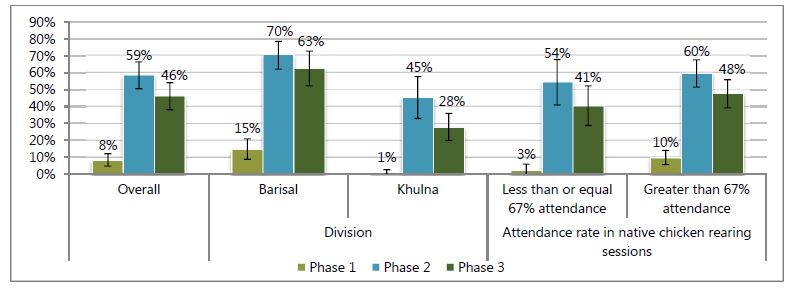
Figure 20: Proportion of Households Currently Growing Vegetables in Homestead Garden
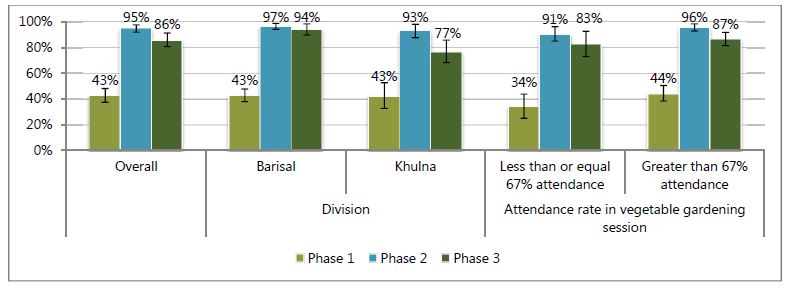
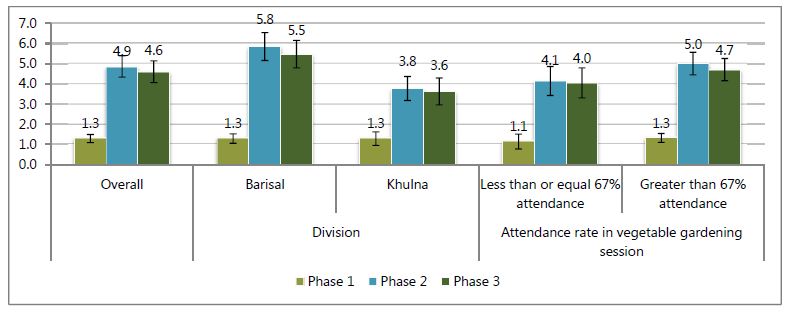
In line with the findings, the quantitative survey indicated that a large proportion of households, slightly over two-fifths, were gardening at the start of the FNS; this increased to 95 percent by the end of the FNS (Figure 20). In addition, the new gardening households managed to maintain a large number of vegetables growing both in phase 2 and phase 3 (Figure 21). The types of vegetables produced nearly quadrupled during this time, and only declined slightly between phase 2 and phase 3. Divisionally, the proportion of households gardening was the same in Khulna and Barisal in phase 1, and only slightly and not significantly higher in phase 2 in Barisal. However, in phase 3 the proportion of households gardening remained almost the same in Barisal, while falling significantly in Khulna. Interestingly, while the mean number of vegetable types grown was also the same in Khulna and Barisal in phase 1, the number of varieties in Khulna increased in phase 2 much less than in Barisal. As could be expected, women who had gardens in phase 1 attended a greater number of FNS sessions in this unit. Similarly, a greater proportion of them maintained gardens in phase 3 and were growing more types of vegetables.
Figure 21: Mean Number of Vegetables Growing at Each Phase
SPRING also promoted selected vegetables and fruits such as pumpkin, bottle gourd, kohlrabi, country bean, radish, red amaranth, green amaranth, yard-long bean, kangkong, red amaranth, Indian spinach, okra, ash gourd, tomato, papaya, and eggplant. For these items, we asked about production specifically for each season since the start of the FNS sessions. In the main text, we will present the selected crops of papaya, pumpkin, kangkong, and red amaranth, but information about all others is available in Annex 3. Notably, the production of most of these key crops continued to increase during the year following the FNS. Papaya production significantly increased in the winter and summer seasons after the FNS sessions. The increase was bigger in Barisal than in Khulna (Figure 22). In contrast, pumpkin production only increased during the monsoon, and the size of the difference was larger in Khulna than in Barisal (Figure 23). Only winter production of kangkong increased (Figure 24), and red amaranth production increased only in summer (Figure 25).
Figure 22: Production of Papaya across Seasons
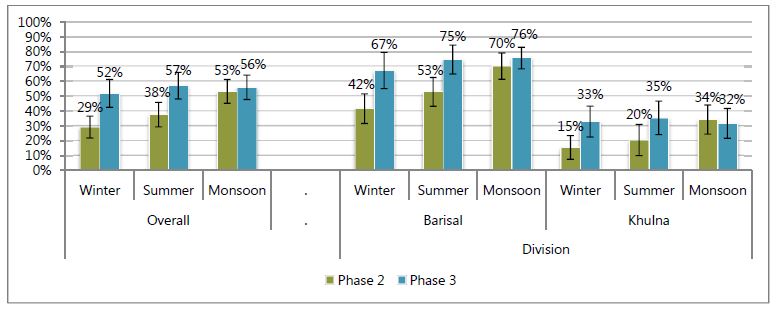
Figure 23: Production of Pumpkin across Seasons
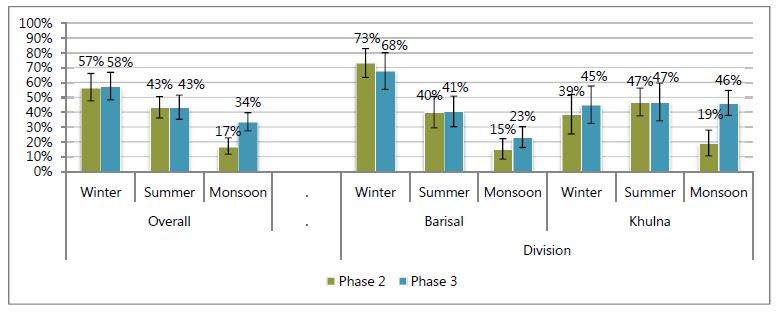
Figure 24: Production of Kangkong across Seasons
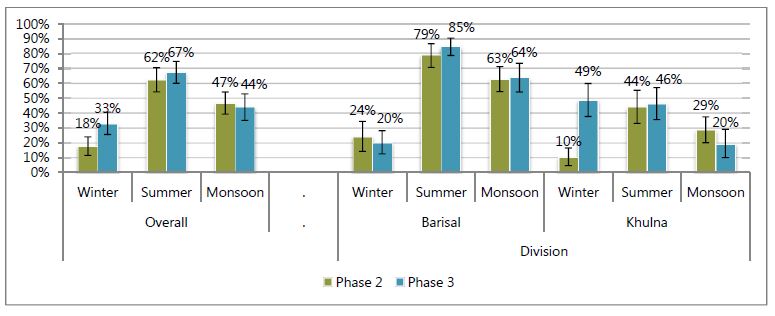
Figure 25: Production of Red Amaranth Across Seasons
Poultry Rearing
Poultry rearing in the homestead is very common in rural Bangladesh. Traditionally, poor people residing in the rural villages usually rear chickens and/or ducks to get eggs and meat; rearing poultry and livestock enables households to earn some extra money to purchase small essentials (Dolberg 2003). We built on this activity through teaching methods that enable highly productive poultry rearing. Similar to gardening, experience in poultry rearing was common among the respondents before training, and only few participants started poultry rearing only after the FNS. However, many benefited from the improved poultry rearing practices introduced: "All of us had the experience of poultry rearing before but not like now. We had only one or two chickens, but after the training now our number of chickens has increased because the birds do not die due to disease like before and we can eat and sell eggs more." These practices have reduced losses: "We had no prior experience in poultry rearing because in our surroundings we saw many people who faced many problems like hens dying frequently, eggs getting damaged, and so on. That's why we didn't rear poultry before, but now after the training we know the benefits of rearing poultry so we now we have started poultry rearing." The new practices also enable greater consumption of eggs: "Now we get eggs five to six times in a year rather than two to three times (from each chicken), which is very helpful for us because with this we can eat and sell the eggs more than before. Our production has increased by using vaccination and our eggs also not getting damaged like before by using the improved hajol [an earthen made hatching pot for chickens]". The consumption of eggs is seen as beneficial for nutrition: "Consuming one egg every day is good for the child and all family members because it has vitamins."
There are also economic benefits: "Now my production and consumption has increased and I sell 4,000 taka worth of chickens and eggs three to four times in a year and for the poor people like us it's very useful." Some women reported earning sizable incomes: "I get 1,200 taka by selling eggs and now I have decided to buy a goat. All family members help me a lot because it helps to improve the family condition and we can eat eggs daily." This increased income was reported to be used for the household and women's needs: "We use this money mostly for our child's educational expenses or if they demand anything. Sometimes we use this money for household expenses." Household production has also reduced the need to spend money for these goods: "If guests come, now we can serve them meat and eggs promptly without being worried. Otherwise we have to wait for our husband to buy something from the market. This saves our husband's money and it's not always possible to entertain [guests] with meat."
Respondents detailed the improved techniques they now use, such as steps that were taken against poultry morbidity: "Knowing what we do from FNS, now we use vaccines, different types of medicines and drops for the chickens so that the hens do not die and are not affected like before, but earlier we didn't know about these things so we couldn't practice [them]." Better food was also provided to the poultry: "Earlier we didn't give food to the hen because no one told us and we didn't know about it, but after attending the [FNS} training we started giving food and "broiler" meal (mixed with rice bran, wheat) to the chicken and it's very important during the hatching period. Nonetheless, now we regularly clean the poultry shed because it protects the poultry from different diseases but before we didn't do that."
Respondents detailed the improved techniques they now use to increase chick production: "Now we use the hatching pot and also can make it at home so that the eggs do not get damaged, but before we didn't get the same amount of chicks as we do now because frequently hens went outside in search of food and water so the eggs got spoiled. However, now we separate the chicks from the hen like in the summer after seven days and in the winter after 15 days of rearing, which is a very useful technique for getting more eggs. At present we get eggs six times in a year rather two to three times in a year." Steps are also taken to reduce lice infestation: "For hatching now we use the [improved] hajol because eggs are not damaged and because we can give food and water together with it. Moreover, now when we put eggs in for hatching, we prepare the hatching pot with neem leaves, ash, and naphthalene, which works in two ways: first it helps to prevent the hen [from getting] an itching disease and on the other hand it helps to keep [the eggs] warmer." Additional care is also now taken with egg selection: "We choose the eggs that are round and at the final stage of laying because generally those eggs are good. Now we know if a chicken's weight is 1 kg, then ½ kg weight of the eggs should be given to the hatching pot otherwise the chicken will lose its weight. Food is also important during the brooding period, so now we try to give clean food timely to maintain the chickens' weight and to prevent damage to the eggs." Participants in the FGD reported many benefits from these practices: "After receiving the training from SPRING, we started rearing poultry properly and significantly profited by continuing these practices. We earn a lot of money by selling eggs and we spend it to meet our own need because we can't always ask our husbands for money. Also, now we can eat meat and eggs frequently and especially our child can eat these [things] regularly."
Some problems persist, notably disease: "Our main obstacle to rearing poultry is disease, because medicines are not available in the village and sometimes we have to use one type of medicine for various kinds of disease because lack of availability. However, the disease burden has decreased because we regularly clean the poultry shed and this helps to reduce disease." Some also noted a lack of space as a constraint: "We are rearing poultry but don't have enough space or a poultry shed so despite our interest we can't rear more and now we keep the chickens inside our home." Despite these difficulties, participants mostly stated that they were very interested in continuing poultry rearing: "By learning these practices, now we are able to rear more chickens than before and get many eggs, which is very useful for us because now we know many things and understand how we can keep hens free from disease and can increase our production. In addition, we can consume eggs almost every day, which is beyond our imagination considering earlier production."
The poultry rearing practices are spreading to the neighbors as well, because of the observed benefits of the new methods: "Many of our neighbors find the [improved] hajol very interesting because food and water (for broody hen) can be provided along with it and they make it with clay by seeing ours and asked us about feeding and vaccinations also." "Now we get eggs frequently and also can sell to our neighbors so they are very eager to know about the techniques and we also told many people about our techniques and they started following us." Respondents report enjoying training others: "When anyone comes to us to know about poultry rearing we feel very good because it's a matter of happiness to teach something."
A household was considered as rearing poultry if the household was currently rearing either chickens or ducks or both at the time of the quantitative survey. Three-fourths of women were rearing poultry before attending the FNS. While this proportion increased slightly across the sample as a whole, both divisions and both attendance groups (Figure 26), more sizable increases were seen in the number of birds reared during these periods (Figures 27 and 28). During phase 1, households were rearing only 7.8 birds on average, but by the end of the FNS this figure had increased to 12 birds. Even after the FNS concluded, the number of birds reared continued to increase to 13 per household. Notably, these continued gains were in Barisal, whereas the number of birds per household leveled off in Khulna. Similar to the case with vegetable gardening, households with who were already rearing poultry during phase 1 attended a greater number of sessions in this unit. Households who attended a greater number of sessions also continued to increase the number of birds kept in the year following the FNS, whereas the number of birds declined among the women with lower levels of attendance.
Figure 26: Proportion of Households Rearing Poultry
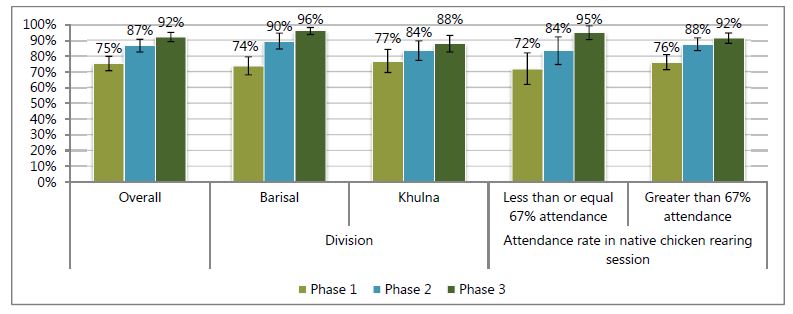
Figure 27: Mean Number of Chickens Reared
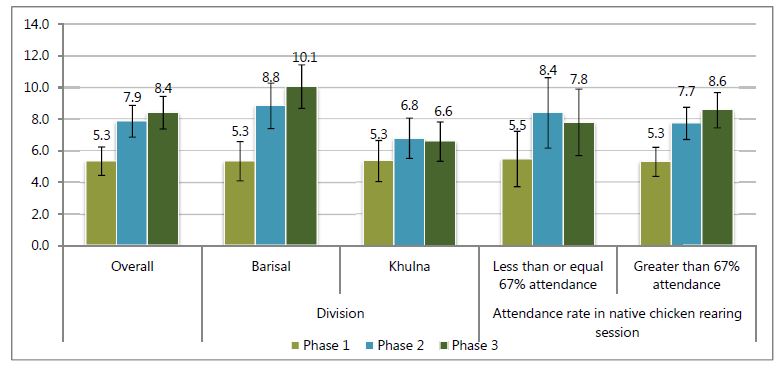
Figure 28: Mean Number of Ducks Reared
Households did not just rear more poultry; they also improved techniques. Vaccination is required about every two weeks for chicks and every six months for adult birds. While only 8 percent of households vaccinated in the three months before phase 1, this proportion increased to nearly three-fifths of households by the end of the FNS sessions, and remained at around one-half of households one year after the FNS sessions had concluded (Figure 29). Initial behavior and uptake of vaccination was greater in Barisal compared to Khulna and in households with better attendance compared to those with worse attendance.
Figure 29: Proportion of Households with Vaccinated Chickens
Fish Culture
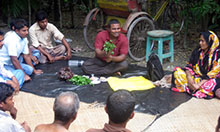
Fish is an important source of protein, micronutrients, and essential fatty acids in Bangladesh (Roos, Thilsted, and Wahab 2002). Aquaculture, or fish farming, can provide a homestead source of many micronutrients and contribute to household income. SPRING provided training and guidelines to improve fish culture techniques. Fish farming is another important component of FNS, but differs from gardening and poultry rearing, as fish production is largely seen as normally within the male domain: "Our husbands and fathers-in-law are directly involved with fish farming, but my participation in the training from FNS created curiosity [among them] to know more about it and now we discuss and tell them many ideas on fish farming, which helps us to increase our production." This enables women to become teachers in their households: "My uncle is mainly involved with fish farming and we don't have any pond. But after receiving the [FNS] training I started fish farming with him and he also listened to my knowledge." Because of the constraints for fish production, namely, the need of a pond, fewer households participated in this activity than gardening and poultry rearing. Regionally, fish farming was more common in Bhola than in Jessore and Khulna.
Those who did practice fish farming reported gains in production: "Our production of fish has increased and we get much more fish than before; because of our regular cleaning of the pond, the fish are growing faster so we can eat toxin-free fish and also sell the fish." Participants also noted the nutritional and food security benefits from fish farming: "Now almost daily we can consume fish; it is not possible for us to buy fish every day from the market and we can get nutrition easily and even production has increased so fish are more available." Women were able to have fish for daily consumption: "For daily consumption, women catch fish by themselves from the pond." Some farmers noted monetary gains: "Now our fish die less than before and we don't have to face any loss and can save our money."
Participants noted that they learned a lot about fish farming from the FNS sessions: "From FNS we learned many things like cleaning pond water with lime, the process of feeding fish, preparing the pond before stocking the fingerlings, and so on, but we didn't know these [things] before and would cultivate fish the traditional way." Respondents noted: "We learned many things from SPRING Bangladesh and the most significant thing which we learned from them was cleaning pond water. Now we clean the water and dyke before stocking the fingerlings and apply lime and cow dung in the pond, which is very effective for the fish's disease prevention as well. We also now observe the oxygen availability in the pond. So our fish grow well, not like before, when the fish's head was big and the tail was thin. Also, now fewer fish die." Participants had greater knowledge of pond aeration: "Sometimes we pull the fish net from one side to another side of the pond water. We do this so that toxic gas which comes from the water [carbon monoxide] is minimized and allows fish to grow well." There is also greater knowledge about pond preparation and acclimatizing fingerlings to the pond: "Most of the time we collect fingerlings using a large cooking pot and mix that pot water with pond water and then stock the fingerlings. But before doing that, we clean the pond water with lime and cow dung and examine the water. First we stock two to three fingerlings into the water. If they survive then we stock all of the fingerlings." As with the other techniques taught through the FNS, some participants already had baseline knowledge: "I learned this technique of fingerlings stocking prior to the participation in the FNS from one of the government's farm programs, but from SPRING I learned many things."
Multistocking was a recommended technique that participants could now engage in: "Now we stock three layers of fish in the pond so that they can eat all the food. If we don't stock fish for all three layers, the fish food will become rotten in the pond and water will also get spoiled and the fish will get affected by diseases. We learned all these things from the [FNS] training and continue practicing [them]. Earlier we just gave fish feed but now we give food two times in a day and mix different types of food, like dried fish, rice, cow dung, et cetera. We make this food into balls and put these in the pond so that every layer of fish can get food easily. This increases the growth and production of fish."
Overall, the proportion of households cultivating fish in a pond increased significantly from 48 percent in phase 1 to 67 percent in phase 2, before declining slightly again to 63 percent in phase 3 (Figure 30). Compared to phase 1, the proportion of households cultivating fish increased in phase 2 and phase 3 in both Barisal and Khulna. However, the improvements in culturing fish were significant in Barisal division only, and continued to increase slightly from phase 2 to phase 3, while they declined slightly in Khulna. There were no significant improvements in the proportion of households culturing fish among participants who attended four or fewer classes of the six pond-fish culturing sessions. However, culturing fish in the pond improved largely in phase 2 and were sustained in phase 3 among participants who attended more than 67 percent of the sessions on culturing pond fish. As seen with the other production methods, households with a pond attended a slightly greater number of sessions on this topic.
Figure 30: Proportion of Households Culturing Any Fish in a Pond
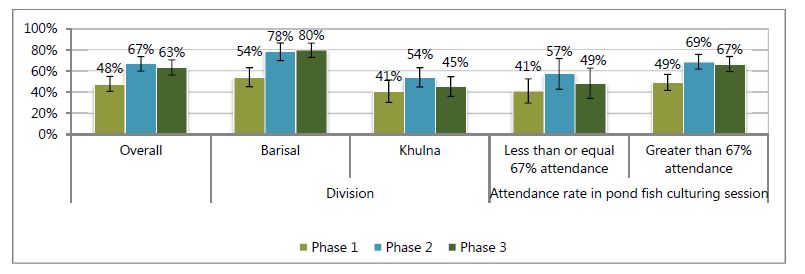
FNS households also changed the varieties of fish that they were rearing. Whereas most households that reared fish reared carp in all phases (Figure 31), the proportion of households rearing small indigenous fish and tilapia grew faster than aquaculture overall (Figures 32 and 33). For all types of fish, increases in Barisal were larger than increases in Khulna and were better sustained in the year after the FNS cycle concluded. In Barisal, the uptake of rearing small indigenous fish increased, while in Khulna it remained that same and then declined after the end of the FNS sessions (Figure 32).
Figure 31: Proportion of Households Culturing Carp in a Pond
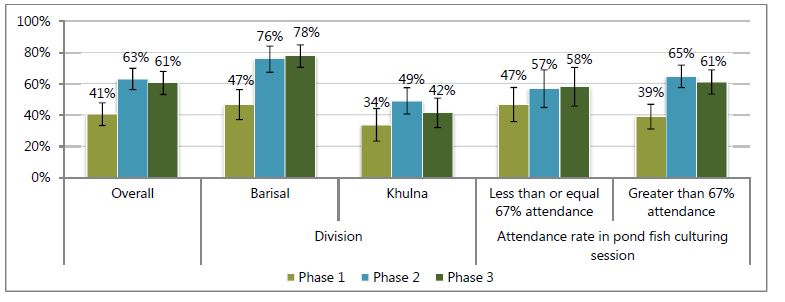
Figure 32: Proportion of Households Culturing Small Indigenous Fish in a Pond
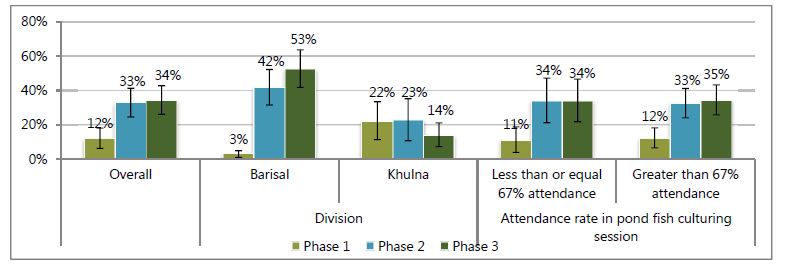
Figure 33: Proportion of Households Culturing Tilapia in a Pond
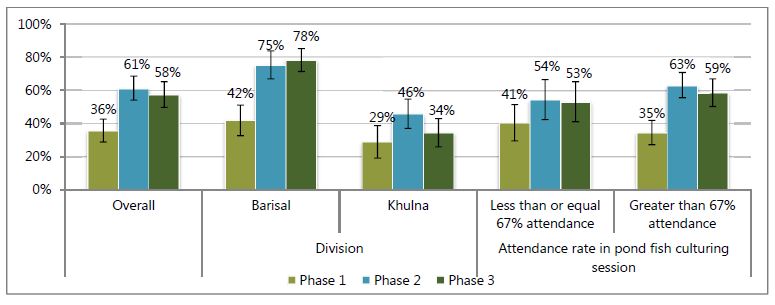
Outcome
SPRING seeks to improve women's and children's diets both directly, through "farm-to-fork" production, and indirectly, through increased empowerment of and income earned by the women participants of the FNS sessions. This section of the report reviews the changes in women's dietary diversity within this cohort of participants over time. To measure dietary change, we asked FNS women to complete a standard 24-hour dietary module, with 17 food types listed in the questionnaire. The measure of dietary diversity used combined the 17 questionnaire food types into a nine-item scale (Kennedy, Ballard, and Dop 2011).2
There were notable increases in the proportion of women eating food from many of these food groups, particularly food groups linked to the FNS program, between phase 1 and phases 2 and 3 (Figure 34). Increases were large for the vitamin A–rich fruits and vegetables as well as other fruits and vegetables food groups, and smaller but still sizable for the dark green leafy vegetables food group. Among the animal source food recorded in this questionnaire list, egg consumption increased more than dairy and flesh foods consumption, though all three groups saw significant increases. The proportion of women eating legumes also nearly doubled. Between phases 2 and 3, only a limited number of food groups showed a substantial reduction in the proportion of women consuming them: vitamin A–rich fruits and vegetables, dark green leafy vegetables, and eggs.
Figure 34: Proportion of Women Consuming Listed Food Groups by Phase and Division
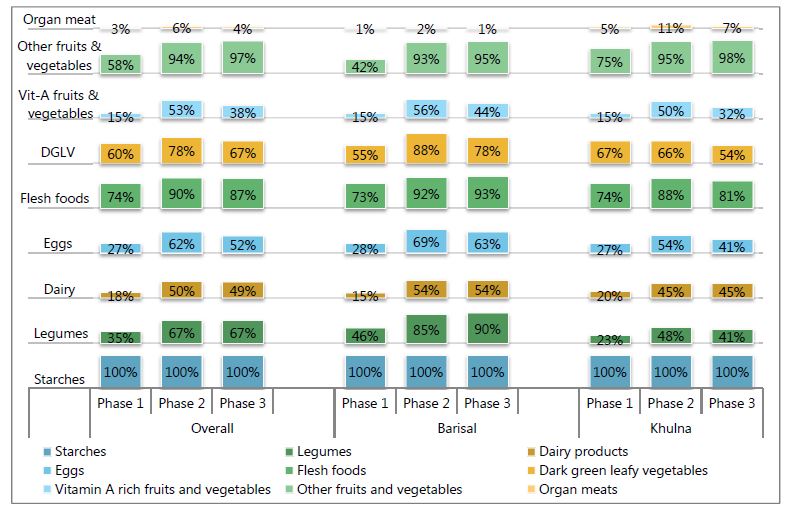
Figure 35: Dietary Diversity Score of Women
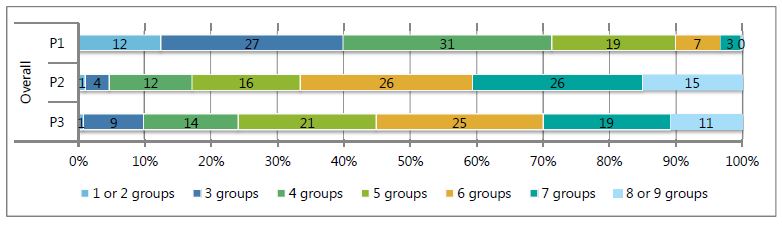
Dietary diversity, the sum of the food groups consumed, is a proxy for dietary sufficiency and a measure of diet quality (Arimond et al. 2009; Swindale and Bilinsky 2006; Ruel, Deitchler and Arimond 2015; Kennedy, Ballard, and Dop 2011). The proportion of women consuming foods from a greater number of food groups increased sharply after the SPRING FNS training sessions (Figure 35). Before the sessions, the majority of women consumed foods from fewer than five food groups, which is the cutoff for dietary adequacy. In phases 2 and 3, the reverse pattern can be seen, with the majority of women consuming five or more food groups. Diets improved more in Barisal than in Khulna (Figures 36 and 37). Interestingly, the mean dietary diversity score was lower for women who attended all FNS sessions in phase 1 compared to women with lower attendance, but was higher than other groups during phases 2 and 3 (Figure 37). Women consumed two more food groups, on average, in phase 2 than in phase 1. Though Khulna had a higher dietary diversity score to begin with, it had lower levels of improvement between phase 1 and phase 2; dietary diversity declined more in Barisal between phase 2 and phase 3.
Figure 36: Adequate Dietary Diversity of FNS Women
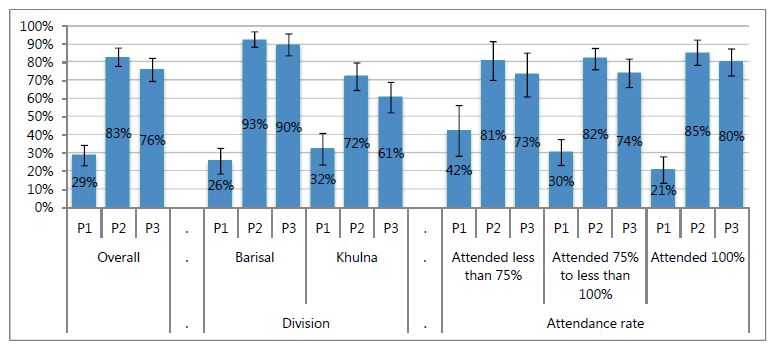
Figure 37: Mean Dietary Diversity Score of FNS Women
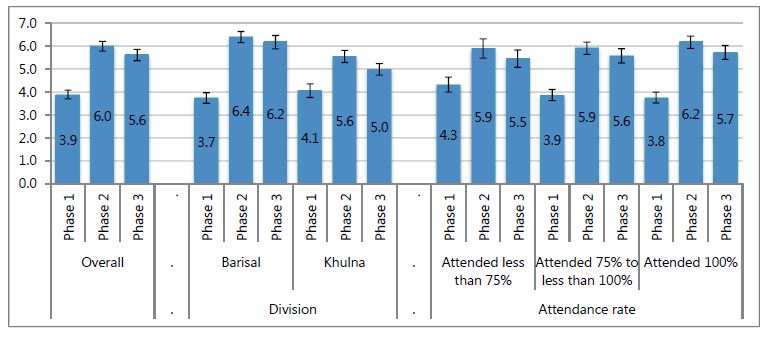
Chapter 4 Multivariate Results
To explore the relationship between background characteristics of FNS participants, attendance in FNS sessions, their uptake of promoted production activities, and changes in women's diets, we undertook multivariate analysis. The models presented below provide information on which participant characteristics were linked to uptake and sustaining of promoted practices. In addition, we estimate which component of PFP practices—gardens, poultry, or fish—is most strongly linked to the improvement in women's dietary diversity. In these models, we use several control variables, including husband's occupation and women's income-earning status, as a proxy for household wealth, and women's education as an indicator of women's resources.
To simplify fitting the multivariate models, we summarized the many variables available in this study that measure PFP practices using factor analysis. We developed four separate scales: 1) gardening, 2) poultry rearing, 3) fishpond management, and 4) all elements combined. Details of the elements used to create the scales used in the section are available in Annex 4. In addition, in each phase, we summed the correct knowledge scores for all women in each round as a linear variable ranging from 0 to 7. For all scales, higher numbers indicate more knowledge and more activity. In these models, we included predictors from earlier and current periods to determine which characteristics drove behavior.
With such high attendance rates, there were very few significant predictors of either perfect or poor FNS attendance (poor attendance was defined as missing four sessions or more, 25 percent of the program) (Table 4). This indicates that the curriculum likely had broad appeal; for example, there were likely no major difficulties in the curriculum for those who were least or most educated. Women with at least one child under three years of age at the end of the program had lower odds of attaining perfect attendance, likely because once the number/age of children at the start of the sessions is controlled for, this indicates giving birth during the sessions. However, no life cycle variables were significantly associated with missing a high proportion of sessions. Women who had some primary education had lower odds of missing a high number of sessions than did women with no education. In contrast, women who practiced more elements of homestead food production (PFP score) at baseline had significantly higher odds of attending the FNS sessions. Women with more nutrition knowledge at baseline also had greater odds of obtaining perfect attendance.
Table 4: Predictors of FNS Attendance
| Perfect attendance | Missing 25%+ sessions | |||
|---|---|---|---|---|
| Odds Ratio | p value | Odds Ratio | p value | |
| Education of women | ||||
| Income earning status in phase 1 | ||||
| Husbands' occupation | ||||
| Life cycle indicators | ||||
| Knowledge and activity | ||||
| No education | Reference category | |||
| Partial Primary | 1.50 | 0.47 | 0.32 | 0.04 |
| Complete Primary | 2.63 | 0.05 | 0.47 | 0.26 |
| Partial Secondary | 1.37 | 0.54 | 0.30 | 0.05 |
| SSC/Dakhil | 0.43 | 0.31 | 0.89 | 0.88 |
| HSC/Aleem/Diploma | 2.06 | 0.34 | 0.25 | 0.14 |
| Not working | Reference category | |||
| Working | 0.93 | 0.85 | 0.97 | 0.95 |
| Own farm worker | Reference category | |||
| Paid farm worker | 0.66 | 0.18 | 0.86 | 0.72 |
| Migrant worker | 0.91 | 0.84 | 0.42 | 0.16 |
| Shop keeper/Street vendor | 0.71 | 0.37 | 0.95 | 0.92 |
| Salaried worker | 0.64 | 0.35 | 1.05 | 0.93 |
| Driver | 0.64 | 0.38 | 0.61 | 0.50 |
| Others | 0.61 | 0.28 | 1.12 | 0.84 |
| Pregnant during FNS (either beginning or end) | 0.92 | 0.90 | 2.16 | 0.26 |
| Child less than 2 years before FNS | 0.86 | 0.82 | 2.88 | 0.16 |
| Child less than 3 years at FNS end | 0.33 | 0.04 | 1.68 | 0.65 |
| Knowledge score | 1.16 | 0.03 | 1.13 | 0.13 |
| PFP score at phase 1 | 0.81 | 0.07 | 1.41 | 0.01 |
| n | 386 | 386 | ||
There were also only limited predictors of improved gardening behavior in phases 2 and 3 (Table 5). Highly educated women (higher secondary certificate (HSC)/Aleem/diploma) had significantly higher gardening activity scores than women with no education at phase 2, but this difference was not significant in phase 3 once we controlled for the phase 2 scores. FNS participants whose husbands worked as paid farm labor, shopkeepers, or salaried workers had significantly lower scores at phase 2 compared to households where husbands primarily worked in own farm labor, but these differences were not significant in phase 3 once we controlled for the phase 2 scores. This finding may indicate that though households with certain income streams had differing abilities to uptake behaviors, this did not affect the likelihood of sustaining such behaviors. Pregnancy status and young children were not significant predictors of gardening knowledge score in either phase, whereas high attendance during the gardening sessions was predictive of gardening activity at phase 2; however, this difference was not significant in phase 3 once we controlled for the phase 2 scores. This difference indicates that attendance is associated with practice uptake but not with sustaining activities aside from higher uptake. Gardening activity scores in the prior phase were significantly positively associated in both models, and during phase 3 both scores during phase 1 and phase 2 were significant predictors. This indicates that households with greater uptake of gardening activities were also more likely to sustain such activities. Knowledge scores were not predictive in either period.
Table 5: Predictors of Gardening Activities
| Gardening score at phase 2 | Gardening score at phase 3 | |||
|---|---|---|---|---|
| Coefficient | p value | Coefficient | p value | |
| Education of women | ||||
| Income earning status in phase 1 | ||||
| Husbands' occupation | ||||
| Life cycle indicators | ||||
| Knowledge and activity | ||||
| No education | Reference category | |||
| Partial Primary | 0.15 | 0.38 | 0.01 | 0.97 |
| Complete Primary | 0.00 | 0.98 | 0.14 | 0.46 |
| Partial Secondary | 0.21 | 0.24 | 0.09 | 0.66 |
| SSC/Dakhil | 0.03 | 0.91 | 0.14 | 0.59 |
| HSC/Aleem/Diploma | 0.67 | 0.00 | 0.23 | 0.42 |
| Not working | Reference category | |||
| Working | 0.28 | 0.10 | 0.13 | 0.28 |
| Own farm worker | Reference category | |||
| Paid farm worker | -0.53 | 0.00 | -0.02 | 0.87 |
| Migrant worker | -0.03 | 0.88 | 0.00 | 0.98 |
| Shop keeper/Street vendor | -0.48 | 0.01 | 0.15 | 0.36 |
| Salaried worker | -0.60 | 0.01 | -0.34 | 0.08 |
| Driver | 0.04 | 0.88 | 0.00 | 1.00 |
| Others | 0.01 | 0.96 | -0.03 | 0.84 |
| Pregnant at survey | -0.22 | 0.48 | -0.30 | 0.15 |
| Child less than 3 years at survey | 0.10 | 0.72 | 0.03 | 0.79 |
| Attendance >5 out of 6 sessions on gardening | 0.26 | 0.01 | 0.11 | 0.28 |
| Knowledge score at phase 1 | -0.06 | 0.05 | 0.01 | 0.79 |
| Gardening score at phase 1 | 0.12 | 0.02 | 0.09 | 0.04 |
| Knowledge score at phase 2 | 0.08 | 0.29 | 0.13 | 0.06 |
| Gardening score at phase 2 | 0.46 | 0.00 | ||
| Knowledge score at phase 3 | 0.14 | 0.06 | ||
| n | 386 | 386 | ||
In contrast to gardening, poultry practices were significantly associated with education in phase 3 but not in phase 2 (Table 6). This indicates that educated women with higher education levels had an easier time maintaining and growing their poultry operation after direct project support had ended. FNS participants whose husbands worked as shopkeepers or salaried workers had significantly lower scores at phase 2 compared to households where husbands primarily worked in own farm labor, but only the difference for salaried worked was still significant in phase 3 once we controlled for the phase 2 scores. Life cycle indicators were not significant predictors of behavior nor was high versus low attendance at the FNS poultry rearing sessions. Poultry activity scores in the prior phase were significantly positively associated in both models, and during phase 3 scores during both phase 1 and phase 2 were significant predictors. Knowledge scores at phase 1 were negatively predictive of poultry activity in phase 3.
Table 6: Predictors of Poultry Rearing Activities
| Poultry score at phase 2 | Poultry score at phase 3 | |||
|---|---|---|---|---|
| Coefficient | p value | Coefficient | p value | |
| Education of women | ||||
| Income earning status in phase 1 | ||||
| Husbands' occupation | ||||
| Life cycle indicators | ||||
| Knowledge and activity | ||||
| No education | Reference category | |||
| Partial Primary | 0.12 | 0.49 | 0.43 | 0.00 |
| Complete Primary | 0.26 | 0.29 | 0.46 | 0.00 |
| Partial Secondary | 0.28 | 0.21 | 0.65 | 0.00 |
| SSC/Dakhil | 0.43 | 0.14 | 0.38 | 0.07 |
| HSC/Aleem/Diploma | 0.36 | 0.15 | 0.85 | 0.00 |
| Not working | Reference category | |||
| Working | 0.09 | 0.64 | 0.08 | 0.54 |
| Own farm worker | Reference category | |||
| Paid farm worker | -0.11 | 0.37 | -0.05 | 0.75 |
| Migrant worker | -0.02 | 0.91 | 0.39 | 0.10 |
| Shop keeper/Street vendor | -0.43 | 0.00 | -0.13 | 0.41 |
| Salaried worker | -0.53 | 0.00 | -0.48 | 0.03 |
| Driver | -0.23 | 0.11 | 0.16 | 0.38 |
| Others | -0.23 | 0.29 | -0.21 | 0.30 |
| Pregnant at survey | -0.04 | 0.90 | -0.09 | 0.66 |
| Child less than 3 years at survey | 0.08 | 0.83 | 0.14 | 0.16 |
| Attendance >5 out of 6 sessions on poultry | 0.04 | 0.77 | 0.09 | 0.39 |
| Knowledge score at phase 1 | -0.05 | 0.15 | -0.04 | 0.04 |
| Poultry score at phase 1 | 0.34 | 0.00 | 0.21 | 0.00 |
| Knowledge score at phase 2 | 0.08 | 0.17 | 0.13 | 0.05 |
| Poultry score at phase 2 | 0.22 | 0.00 | ||
| Knowledge score at phase 3 | 0.06 | 0.38 | ||
| n | 386 | 386 | ||
High education levels (greater than SSC/Dakhil) were associated with higher fishpond management scores in phase 2 compared to no education, but these differences were not significant in phase 3 once we controlled for the phase 2 scores (Table 7). This finding indicates that education correlated with uptake of activities but not with sustaining them afterward. FNS participants whose husbands worked as paid farm labor had significantly lower scores at phase 2 compared to households where husbands primarily worked in own farm labor, but this difference was not significant in phase 3 once we controlled for the phase 2 scores. Life cycle indicators were not significant predictors of behavior, nor was high versus low attendance at the FNS fishpond management sessions. Fishpond activity scores in the prior phase were significantly positively associated in both models, and during phase 3 scores during both phase 1 and phase 2 were significant predictors. Knowledge scores at phase 1 were negatively predictive of fishpond management activity in phase 3.
Table 7: Predictors of Fishpond Activities
| Fishpond score at phase 2 | Fishpond score at phase 3 | |||
|---|---|---|---|---|
| Coefficient | p value | Coefficient | p value | |
| Education of women | ||||
| Income earning status in phase 1 | ||||
| Husbands' occupation | ||||
| Life cycle indicators | ||||
| Knowledge and activity | ||||
| No education | Reference category | |||
| Partial Primary | 0.07 | 0.67 | -0.01 | 0.95 |
| Complete Primary | 0.10 | 0.54 | 0.04 | 0.77 |
| Partial Secondary | 0.27 | 0.10 | 0.02 | 0.88 |
| SSC/Dakhil | 0.46 | 0.03 | 0.12 | 0.64 |
| HSC/Aleem/Diploma | 0.63 | 0.02 | 0.01 | 0.96 |
| Not working | Reference category | |||
| Working | -0.12 | 0.23 | -0.30 | 0.00 |
| Own farm worker | Reference category | |||
| Paid farm worker | -0.36 | 0.00 | -0.04 | 0.76 |
| Migrant worker | 0.21 | 0.24 | 0.24 | 0.32 |
| Shop keeper/Street vendor | -0.26 | 0.09 | -0.22 | 0.18 |
| Salaried worker | -0.18 | 0.39 | -0.04 | 0.86 |
| Driver | -0.41 | 0.03 | -0.23 | 0.25 |
| Others | -0.33 | 0.03 | 0.01 | 0.93 |
| Pregnant at survey | -0.10 | 0.69 | -0.09 | 0.46 |
| Child less than 3 years at survey | -0.15 | 0.46 | 0.09 | 0.32 |
| Attendance >5 out of 6 sessions on fish | 0.21 | 0.10 | 0.18 | 0.11 |
| Knowledge score at phase 1 | -0.14 | 0.00 | -0.05 | 0.12 |
| Fish score at phase 1 | 0.42 | 0.00 | 0.12 | 0.00 |
| Knowledge score at phase 2 | 0.05 | 0.34 | 0.09 | 0.11 |
| Fish score at phase 2 | 0.51 | 0.00 | ||
| Knowledge score at phase 3 | 0.08 | 0.14 | ||
| n | 386 | 386 | ||
For all three PFP mechanisms combined, higher education levels (starting with partial secondary completion) were associated with greater activity scores in phase 2 compared to no education, and the coefficients were larger for the higher levels of education within this group (Table 8). These differences were not significant in phase 3 once we controlled for the phase 2 scores. This finding indicates that women with more education took up more of these practices than did less educated participants, but there was no difference by educational level in sustaining these practices. FNS participants whose husbands worked as paid farm labor and in salaried occupation had significantly lower scores at phase 2 compared to households where husbands primarily worked in own farm labor, but these differences were not significant in phase 3 once we controlled for the phase 2 scores. Life cycle indicators were not significant predictors of behavior at either phase. Higher attendance rates were associated with greater activity in both phases, but only for perfect attendance in phase 2 and for all attendance rates higher than 14 sessions in phase 3. This could indicate either that women who were motivated to attend all or most sessions were motivated to take up and sustain promoted practices, or that women who attended a greater number of sessions were given the knowledge to take up and sustain promoted practices. PFP activity scores in the prior phase were significantly positively associated in both models, and during phase 3 scores during both phase 1 and phase 2 were significant predictors. Knowledge scores at phase 1 were negatively predictive of PFP activity in phase 2, but knowledge scores in phases 2 and 3 were positively predicative of PFP activity in phase 3, even after we accounted for phase 2 PFP scores.
Table 8: Predictors of All Three Food Production Activities Promoted by the FNS
| PFP score at phase 2 | PFP score at phase 3 | |||
|---|---|---|---|---|
| Coefficient | p value | Coefficient | p value | |
| Education of women | ||||
| Income earning status in phase 1 | ||||
| Husbands' occupation | ||||
| Life cycle indicators | ||||
| Attendance | ||||
| Knowledge and activity | ||||
| No education | Reference category | |||
| Partial Primary | 0.18 | 0.33 | 0.18 | 0.16 |
| Complete Primary | 0.11 | 0.55 | 0.25 | 0.07 |
| Partial Secondary | 0.40 | 0.03 | 0.26 | 0.06 |
| SSC/Dakhil | 0.63 | 0.02 | 0.25 | 0.26 |
| HSC/Aleem/Diploma | 0.81 | 0.00 | 0.40 | 0.08 |
| Not working | Reference category | |||
| Working | -0.09 | 0.46 | -0.02 | 0.88 |
| Own farm worker | Reference category | |||
| Paid farm worker | -0.57 | 0.00 | -0.06 | 0.60 |
| Migrant worker | 0.06 | 0.74 | 0.28 | 0.23 |
| Shop keeper/Street vendor | -0.39 | 0.02 | 0.01 | 0.96 |
| Salaried worker | -0.47 | 0.05 | -0.29 | 0.16 |
| Driver | -0.31 | 0.13 | 0.06 | 0.72 |
| Others | -0.27 | 0.07 | 0.02 | 0.87 |
| Pregnant at survey | -0.24 | 0.49 | -0.27 | 0.16 |
| Child less than 3 years at survey | -0.02 | 0.95 | 0.16 | 0.08 |
| Less than 14 out of 18 FNS sessions | Reference category | |||
| 14 to 17 FNS sessions | 0.04 | 0.77 | 0.21 | 0.01 |
| All 18 FNS sessions | 0.35 | 0.03 | 0.26 | 0.01 |
| Knowledge score at phase 1 | -0.19 | 0.00 | -0.02 | 0.52 |
| PFP score at phase 1 | 0.19 | 0.00 | 0.15 | 0.00 |
| Knowledge score at phase 2 | 0.04 | 0.46 | 0.16 | 0.01 |
| PFP score at phase 2 | 0.53 | 0.00 | ||
| Knowledge score at phase 3 | 0.15 | 0.02 | ||
| n | 386 | 386 | ||
Table 9 presents two models to predict women's dietary diversity scores during phase 1. Model 1, on the left, uses the combined PFP score; model 2, on the right, uses the three separate indexes for the three promoted food production activities. Dietary diversity was not associated with women's education in either model, nor was women's income-earning status. FNS participants whose husbands worked as paid farm labor had significantly worse diets in both models compared to households where husbands primarily worked in own farm labor. FNS participants whose husbands worked as drivers or with an uncommon income source (other category) also had lower dietary diversity only in model 2. Pregnancy was associated with an increase in dietary diversity in model 1 but not in model 2. Greater nutrition and health knowledge was positively associated with greater dietary diversity in both models. Of the food production scores, only the fishpond score was significantly associated with dietary diversity. Altogether, these findings indicate that, at baseline, there were very few significant predictors of diet and participation in PFP was not yet associated with better diets, even though nutritional knowledge did predict better diets. In other words, there was no clear farm-to-fork relationship, but there was a relationship between nutritional knowledge and better diets, perhaps though dietary choice.
Table 9: Predictors of Women's Dietary Diversity in Phase 1
| Dietary Diversity (P1) | Dietary Diversity (P1) | |||
|---|---|---|---|---|
| Coefficient | p value | Coefficient | p value | |
| Education of women | ||||
| Income earning status in phase 1 | ||||
| Husbands' occupation | ||||
| Life cycle indicators | ||||
| Knowledge and activity | ||||
| No education | Reference category | |||
| Partial Primary | -0.25 | 0.34 | -0.30 | 0.29 |
| Complete Primary | -0.23 | 0.35 | -0.26 | 0.30 |
| Partial Secondary | 0.07 | 0.78 | 0.01 | 0.96 |
| SSC/Dakhil | 0.33 | 0.40 | 0.19 | 0.64 |
| HSC/Aleem/Diploma | -0.19 | 0.62 | -0.22 | 0.58 |
| Not working | Reference category | |||
| Working | 0.05 | 0.76 | 0.11 | 0.49 |
| Own farm worker | Reference category | |||
| Paid farm worker | -0.63 | 0.00 | -0.60 | 0.00 |
| Migrant worker | -0.21 | 0.34 | -0.17 | 0.43 |
| Shop keeper/Street vendor | -0.07 | 0.73 | -0.10 | 0.63 |
| Salaried worker | 0.09 | 0.73 | 0.09 | 0.74 |
| Driver | -0.53 | 0.05 | -0.51 | 0.05 |
| Others | -0.47 | 0.04 | -0.48 | 0.03 |
| Pregnant at survey | 0.78 | 0.04 | 0.70 | 0.10 |
| Child less than 2 years | 0.80 | 0.05 | 0.75 | 0.10 |
| Knowledge score at phase 1 | 0.06 | 0.00 | 0.16 | 0.00 |
| PFP score at phase 1 | 0.11 | 0.08 | ||
| Gardening score at phase 1 | -0.03 | 0.59 | ||
| Poultry score at phase 1 | 0.10 | 0.10 | ||
| Fishpond score at phase 1 | 0.20 | 0.00 | ||
| n | 386 | 386 | ||
Table 10 presents two models to predict women's dietary diversity scores during phase 2. Model 1, on the left, uses the combined PFP score; model 2, on the right, uses the three separate indexes for the three PFP activities. Dietary diversity was not associated with women's education in either model, nor was women's income-earning status. FNS participants whose husbands worked as shopkeepers had significantly better diets in both models compared to households where husbands worked primarily in own farm labor. Life cycle indicators were not significantly associated with dietary diversity in either model, nor was attendance at the FNS sessions. Greater nutrition and health knowledge was positively associated with greater dietary diversity in both models and at both the current and prior period. Knowledge scores in the current period were significantly positively associated with dietary diversity in both models, whereas scores in the prior period (phase 1) were significantly negatively associated with current dietary diversity. Of the food production scores, only scores in phase 2 were significantly associated with dietary diversity (the overall score in model 1 being significant and the gardening, poultry, and fishpond scores in model 2), and the relationship was positive. Surprisingly, dietary diversity scores in phase 1 were not associated with dietary diversity scores in phase 2; this could be a result of the change in season between the two rounds. Altogether, these findings indicate that, directly after completion of the FNS, the association between homestead food production and better diets strengthened, while the nutritional knowledge continued to remain important. In other words, the farm-to-fork relationship became significant overall and for all three components of food production individually. The coefficients for all three activity scores were roughly the same, indicating a similar contribution to better diets from gardening, poultry rearing, and fishpond culture.
Table 10: Predictors of Women's Dietary Diversity in Phase 2
| Dietary Diversity (P2) | Dietary Diversity (P2) | |||
|---|---|---|---|---|
| Model 1 | Model 2 | |||
| Coefficient | p value | Coefficient | p value | |
| Education of women | ||||
| Income earning status in phase 1 | ||||
| Husbands' occupation | ||||
| Life cycle indicators | ||||
| Attendance | ||||
| Knowledge and activity | ||||
| Past dietary diversity | ||||
| No education | Reference category | |||
| Partial Primary | 0.42 | 0.22 | 0.47 | 0.19 |
| Complete Primary | 0.37 | 0.30 | 0.39 | 0.29 |
| Partial Secondary | 0.57 | 0.10 | 0.60 | 0.10 |
| SSC/Dakhil | 0.44 | 0.31 | 0.50 | 0.26 |
| HSC/Aleem/Diploma | 0.47 | 0.35 | 0.48 | 0.35 |
| Not working | Reference category | |||
| Working | 0.04 | 0.84 | 0.00 | 0.99 |
| Own farm worker | Reference category | |||
| Paid farm worker | -0.13 | 0.43 | -0.13 | 0.40 |
| Migrant worker | -0.44 | 0.05 | -0.44 | 0.04 |
| Shop keeper/Street vendor | 0.59 | 0.00 | 0.66 | 0.00 |
| Salaried worker | -0.20 | 0.44 | -0.16 | 0.51 |
| Driver | 0.07 | 0.80 | 0.05 | 0.87 |
| Others | -0.02 | 0.92 | -0.03 | 0.89 |
| Pregnant during survey | -0.64 | 0.18 | -0.65 | 0.19 |
| Child less than 3 years | -0.57 | 0.08 | -0.58 | 0.09 |
| Less than 14 out of 18 FNS sessions | Reference category | |||
| 14 to 17 FNS sessions | -0.13 | 0.45 | -0.20 | 0.26 |
| All 18 FNS sessions | 0.10 | 0.62 | 0.06 | 0.78 |
| Knowledge score at phase 1 | -0.18 | 0.00 | -0.20 | 0.26 |
| PFP score at phase 1 | 0.05 | 0.50 | ||
| Gardening score at phase 1 | 0.11 | 0.13 | ||
| Poultry score at phase 1 | -0.10 | 0.17 | ||
| Fishpond score at phase 1 | -0.02 | 0.71 | ||
| Knowledge score at phase 2 | 0.24 | 0.00 | 0.23 | 0.01 |
| PFP score at phase 2 | 0.37 | 0.00 | ||
| Gardening score at phase 2 | 0.20 | 0.00 | ||
| Poultry score at phase 2 | 0.16 | 0.02 | ||
| Fishpond score at phase 2 | 0.20 | 0.01 | ||
| Dietary diversity score at phase 1 | -0.06 | 0.25 | -0.04 | 0.42 |
| n | 386 | 386 | ||
Table 11 presents two models to predict women's dietary diversity scores during phase 3, with similar modeling structure to that found in Tables 9 and 10. Similar to previous models, dietary diversity was not associated with women's education in either model, nor was women's income-earning status. FNS participants whose husbands worked as shopkeepers had significantly better diets in both models compared to households where husbands primarily worked in own farm labor, while FNS participants whose husbands had "other occupations" had significantly worse diets in model 1. Life cycle indicators were not significantly associated with dietary diversity in either model, nor was attendance in the FNS sessions. Phase 1 nutrition and health knowledge was negatively associated with dietary diversity in both models, and this indicator was not significant in other phases. Of the food production scores, only scores in phase 3 were significantly associated with dietary diversity (the overall score in model 1 being significant and the gardening and poultry scores in model 2), and the relationship was positive. Dietary diversity scores in phase 2 but not in phase 1 were associated with dietary diversity scores in phase 3; this could be due to seasonal differences between phases. In total, this indicates that, one year after the completion of the FNS, the association between on-homestead food production and better diets remained strong, while the nutritional knowledge was less important. In other words, the farm-to-fork relationship continued to be significant overall and for two of the three components of food production individually (gardening and poultry). The coefficients for gardening and poultry activity scores were double the size of fishpond culture, and significant while fishpond culture was not, indicating a larger contribution to better diets from gardening and poultry rearing than fishpond culture, in the longer term.
Table 11: Predictors of Women's Dietary Diversity in Phase 3
| Dietary Diversity (P3) | Dietary Diversity (P3) | |||
|---|---|---|---|---|
| Model 1 | Model 2 | |||
| Coefficient | p value | Coefficient | p value | |
| Education of women | ||||
| Income earning status in phase 1 | ||||
| Husbands' occupation | ||||
| Life cycle indicators | ||||
| Attendance | ||||
| Knowledge and activity | ||||
| Past dietary diversity | ||||
| No education | Reference category | |||
| Partial Primary | -0.05 | 0.84 | -0.12 | 0.63 |
| Complete Primary | -0.05 | 0.86 | -0.10 | 0.73 |
| Partial Secondary | 0.18 | 0.50 | 0.10 | 0.69 |
| SSC/Dakhil | 0.01 | 0.98 | 0.04 | 0.91 |
| HSC/Aleem/Diploma | 0.36 | 0.40 | 0.28 | 0.52 |
| Not working | Reference category | |||
| Working | 0.20 | 0.15 | 0.10 | 0.44 |
| Own farm worker | Reference category | |||
| Paid farm worker | 0.09 | 0.53 | 0.13 | 0.39 |
| Migrant worker | -0.07 | 0.79 | -0.08 | 0.77 |
| Shop keeper/Street vendor | 0.49 | 0.02 | 0.50 | 0.01 |
| Salaried worker | 0.17 | 0.55 | 0.28 | 0.31 |
| Driver | 0.29 | 0.16 | 0.28 | 0.16 |
| Others | -0.41 | 0.04 | -0.37 | 0.06 |
| Pregnant during survey | -0.25 | 0.14 | -0.21 | 0.23 |
| Child less than 3 years | 0.00 | 0.99 | 0.02 | 0.86 |
| Less than 14 out of 18 FNS sessions | Reference category | |||
| 14 to 17 FNS sessions | -0.09 | 0.54 | -0.07 | 0.67 |
| All 18 FNS sessions | -0.02 | 0.91 | 0.01 | 0.96 |
| Knowledge score at phase 1 | -0.15 | 0.00 | -0.15 | 0.00 |
| PFP score at phase 1 | -0.08 | 0.21 | ||
| Gardening score at phase 1 | -0.10 | 0.09 | ||
| Poultry score at phase 1 | 0.05 | 0.35 | ||
| Fishpond score at phase 1 | -0.10 | 0.17 | ||
| Knowledge score at phase 2 | 0.08 | 0.31 | 0.07 | 0.43 |
| PFP score at phase 2 | -0.09 | 0.21 | ||
| Gardening score at phase 2 | 0.00 | 0.99 | ||
| Poultry score at phase 2 | -0.06 | 0.38 | ||
| Fishpond score at phase 2 | 0.01 | 0.86 | ||
| Knowledge score at phase 3 | 0.07 | 0.54 | 0.06 | 0.63 |
| PFP score at phase 3 | 0.58 | 0.00 | ||
| Gardening score at phase 3 | 0.31 | 0.00 | ||
| Poultry score at phase 3 | 0.30 | 0.00 | ||
| Fishpond score at phase 3 | 0.16 | 0.05 | ||
| Dietary diversity score at phase 1 | 0.08 | 0.20 | 0.08 | 0.17 |
| Dietary diversity score at phase 2 | 0.28 | 0.00 | 0.29 | 0.00 |
| n | 386 | 386 | ||
Chapter 5 Discussion
The women enrolled in the SPRING/Bangladesh FNS program experienced many positive changes in their nutrition-related practices during and in the year following the FNS training. The full scale of these large changes was unlikely to be caused by factors external to the FNS program, but this assumption cannot be tested, as the study did not contain a control group. Nevertheless, consistently large gains, especially between the baseline and phase 2, with mostly small declines after the nine-month period between phases 1 and 2, suggest that FNS beneficiaries directly benefited from participation in the sessions, and retained most of their knowledge and behavior changes nine months later. Notably, poultry activities continued to increase even after FNS completion.
Multivariate analysis indicates that attendance in the sessions was difficult to predict, a positive finding since it indicates that nonattendance was not associated with any particular education, suggesting that perhaps the sessions were applicable to women of greatly varying education levels and having different resources and experience with the production activities promoted. Women who attended 100 percent of FNS sessions, or even more than 75 percent, were likely to have slightly better outcomes that those who missed sessions, but the differences were not great, and even those who had attendance levels below 75 percent of sessions had decent gains between phase 1 and phase 2.
The qualitative component of our cohort study identified that many aspects of SPRING's FNS work played an important role in improving the ability of poor women to provide nutritious food and proper nutrition to their children as well as their entire family. Their FGD responses make it clear that the FNS participants have continued the practices they learned from the FNS sessions, including homestead gardening, poultry rearing, handwashing, and nutrition practices, and that the techniques and lessons they learned have helped change the way they handle food, nutrition, and hygiene in their homes. This was true among both the high- and low-performing groups. Fish farming was practiced by fewer participants compared to other food production components, due to practical constraints such as geographical location and availability of resources. Despite these barriers, however, most FNS participants tried to carry out all of the practices as much as possible, and important signs of buy-in, sustained behavior change and even spillover, can be noted from the FGD findings.
Similarly, there were only a few consistent predictors of the program element uptake. Women with higher levels of education had higher food production activity scores, but these elements explained little of the overall change in the participants' behavior. The link between education and uptake of food production activities was stronger for poultry and fishpond cultivation than for gardening, and larger for sustaining activities than for uptake during the FNS sessions. This might be due to difficulties that less educated women would have in accessing technical support after completion of FNS. Dietary change was better predicted by food production activities in phases 2 and 3 than in phase 1, indicating that the FNS may have strengthened the link between production and consumption. This finding was also reported by women themselves through the focus groups discussions.
Knowledge on IYCF and other nutrition topics almost universally rose sharply between phases 1 and 2, and stayed high through phase 3. The percentage of women consuming specific nutrient-rich food groups increased dramatically between phases 1 and 2, and remained high in phase 3. The same was true for the proportion of women consuming at least five food groups. The mean number of food groups consumed showed the same pattern.
Between phase 1 and phase 2, the use of tippy taps jumped from 0 percent to 70 percent overall, but declined quite strongly between phases 2 and 3, as people went back to using tube wells and buckets as their primary handwashing stations. But on a positive note, handwashing practices, which also increased sharply between phase 1 and phase 2, remained almost as high or even continued increasing in Barisal and overall, with relatively mild declines in Khulna. Thus, tippy taps may have helped get people started with better handwashing, but use of tippy taps dropped in phase 3. The prevalence of handwashing practices, however, remained high.
Overall, results in Barisal were substantially more positive than in Khulna, between all phases, but especially in terms of retention of gains between phases 2 and 3. Both divisions showed important changes between phases 1 and 2, though in nearly all cases the changes were greater in Barisal than in Khulna. The study team was unable to categorically determine why the changes in Barisal were larger and better sustained, though it may have to do with the geographical, cultural, and socioeconomic factors that differentiate the two divisions.
The findings from this cohort study clearly show that the desired knowledge and practices associated with nutrition-specific and nutrition-sensitive actions improved over time. Further, the findings indicate that the majority of the actions were sustained even one year after the intensive FNS activity had come to a close. This study provides evidence that multisectoral, integrated nutrition activities using food production as a base, such as the FNS activity, with minimal inputs and a short intervention period, can have a dramatic influence on sustained behavior change for improved nutritional outcomes.
To view the annexes, please download the full report above.
Footnotes
1 For more information, please visit www.spring-nutrition.org/bangladesh.
2 This was the indicator in use at the time of the phase 1, and we did not shift to the new 10 food-group indicator for later phases as that would have made comparisons across the phases difficult. The nine items are starches, dairy products, legumes, dark green leafy vegetables, vitamin A–rich fruits and vegetables, other fruits and vegetables, flesh foods (fish, chicken, beef, etc.), eggs, and organ meats.
References
Arimond, M., L. E. Torheim, D. Wiesemann, M. Joseph, and A. Carriquiry. 2009. Dietary Diversity as a Measure of the Micronutrient Adequacy of Women's Diets: Results from Rural Bangladesh Site. Washington, DC: Food and Nutrition Technical Assistance Project (FANTA)/Academy for Educational Development.
Bangladesh Bureau of Statistics (BBS), World Food Programme (WFP), Institute for Public Health and Nutrition (IPHN), and United Nations' Children's Fund (UNICEF). 2009. Bangladesh Household Food Security and Nutrition Assessment Report 2009. New York/Rome: BBS/WFP/IPHN/UNICEF.
Bangladesh Bureau of Statistics (BBS) and United Nations Children's Fund (UNICEF). 2007. Bangladesh Multiple Indicator Cluster Survey 2006: Final Report. Vol. I: Technical Report. Dhaka: BBS/UNICEF.
Black, R. E., L. H. Allen, Z. A. Bhutta, L. E. Caulfield, M. de Onis, M. Ezzati, C. Mathers, and J. Rivera for the Maternal and Child Undernutrition Study Group. 2008. “Maternal and Child Undernutrition: Global and Regional Exposures and Health Consequences.” The Lancet 371(9608): 243–60.
Dewey, K., C. Lutter, J. Martines, and B. Daelmans. 2001. Guiding Principles for the Complementary Feeding of the Breastfed Child. Washington, DC: Pan American Health Organization/World Health Organization.
Dolberg, F. 2003. The Review of Household Poultry Production as a Tool in Poverty Reduction with Focus on Bangladesh and India. FAO Pro-Poor Livestock Policy Initiative Working Paper No. 6. London: Department for International Development.
Fischer Walker, C. L., J. Perin, M. J. Aryee, C. Boschi-Pinto, and R. E. Black. 2012. “Diarrhea Incidence in Low- and Middle-Income Countries in 1990 and 2010: A Systematic Review.” BMC Public Health 12: 220.
Helen Keller International (HKI) and James P. Grant School of Public Health (JPGSPH). 2011. State of Food Security and Nutrition in Bangladesh: 2010. Dhaka: HKI/JPGSPH.
Institute of Public Health Nutrition (IPHN). 2007. National Strategy for Infant and Young Child Feeding in Bangladesh. Dhaka: Directorate General of Health Services, Ministry of Health and Family Welfare, Government of the People's Republic of Bangladesh.
International Centre for DIarrheal DIseases Research, Bangladesh (icddr,b), WaterAid Bangladesh, and Policy Support Unit, Local Government Division, Ministry of Local Government, Rural Development, and Cooperatives. 2014. Bangladesh National Hygiene Baseline Survey. Dhaka: Government of the People's Republic of Bangladesh. 978-984-90017-9-9.
SPRING. 2016. “SPRING/BANGLADESH Country Achievements: November 2016.” Fact sheet/infographic. Arlington, VA: Strengthening Partnerships, Results, and Innovations in Nutrition Globally (SPRING) project.
Kennedy, G., T. Ballard, and M. C. Dop. 2011. Guidelines for Measuring Household and Individual Dietary Diversity. Rome: Food and Agriculture Organization.
Krebs, N. F. 2000. “Dietary Zinc and Iron Sources, Physical Growth, and Cognitive Development of Breastfed Infants.” Journal of Nutrition 130(2S): 358S–360S.
Magnani, R. 1997. Sampling Guide. Washington, DC: Food and Nutrition Technical Assistance Project/Academy for Educational Development. http://www.eldis.org/vfile/upload/1/document/0708/DOC6897.pdf.
National Institute of Population Research and Training (NIPORT), Mitra and Associates, and Macro International. 2009. Bangladesh Demographic and Health Survey 2007. Dhaka/Calverton, MD: NIPORT/Mitra and Associates/Macro International.
Roos, N., S. H. Thilsted, and M. A. Wahab. 2002. Culture of Small Indigenous Fish Species in Seasonal Ponds in Bangladesh: The Potential for Production and Impact on Food and Nutrition Security. New York: CAB International.
Ruel, M. T., M. Deitchler, and M. Arimond. 2015. “Developing Simple Measures of Women's Diet Quality in Developing Countries: Overview.” Journal of Nutrition 140: 11.
SPRING. 2015. Farmer Nutrition School Session Guide on Essential Nutrition Actions, Essential Hygiene Actions, and Homestead Food Production. Arlington, VA: The Strengthening Partnerships, Results, and Innovations in Nutrition Globally (SPRING) Project.
Swindale, A., and P. Bilinsky. 2006. Household Dietary Diversity Score (HDDS) for Measurement of Household Food Access: Indicator Guide. Version 2. Washington, DC: Food and Nutrition Technical Assistance Project (FANTA)/Academy for Educational Development.
WHO/UNICEF Joint Monitoring Programme for Water Supply and Sanitation (JMP). 2010. JMP Technical Task Force Meeting on Monitoring Drinking-Water Quality: Report. Geneva: WHO.
World Health Organization (WHO) and United Nation's Children's Fund (UNICEF). 1998. Complementary Feeding of Young Children in Developing Countries: A Review of Current Scientific Knowledge. Geneva: WHO.