Findings, March 2016
Background
Anemia is a pressing public health problem with many direct and indirect causes that often coexist and act synergistically. Most notable among the drivers of anemia are iron and other nutrient deficiencies, inflammation and infections (malaria and helminthes), and genetic blood disorders. Preventing and controlling anemia require understanding the leading causes of anemia in a given setting and implementing integrated programs to address these underlying causes.
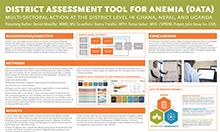
SPRING has developed a District Assessment Tool for Anemia (DATA) to assist countries in strengthening anemia programming at the district level. We developed the DATA tool to increase awareness about the multi-factorial nature of anemia, better understand what drives anemia is in a given context, and help districts plan and prioritize anemia actions using local data. The tool's comprehensive nature allows users to discover facets of anemia prevention and control they might have not considered and recognize the multi-sectoral effort needed for prevention and treatment.
Facilitators should use DATA in a workshop setting to guide district program managers and planners to improve anemia programs in their district. After users enter information into questionnaires in the tool's Microsoft Excel interface, the tool presents outputs in multiple tabs. These outputs help district managers—
- determine the local contextual factors that contribute to anemia in their district
- identify the gaps, enablers, and barriers to addressing the risk factors that lead to anemia
- identify actions to improve anemia-related programming and prioritize these actions to combat anemia.
SPRING developed the DATA tool with design assistance from the John Snow, Inc. (JSI) Center for Health Information, Monitoring, and Evaluation (CHIME). A DATA Advisory Group that includes experts in anemia programs, health management information systems, district planning, and epidemiological study design, is guiding DATA's development.
Methods
SPRING/Ghana field tested DATA in collaboration with the Ghana Health Service in Kumbungu district in July-August 2015. First, the tool underwent "ground-truthing" at a half-day workshop at the regional level in Tamale. This was followed by a two-day district-level workshop in Kumbungu. The "ground-truthing" exercise was designed to elicit feedback from regional-level officials about the suitability of the tool for the local context. We chose this level because program managers at the regional level oversee more than one district, and are thus familiar with differences between districts. Since the tool is meant to be used across multiple districts, the ground-truthing provided feedback on usability and relevance to the overall Northern region.
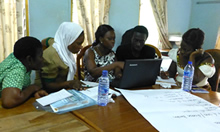
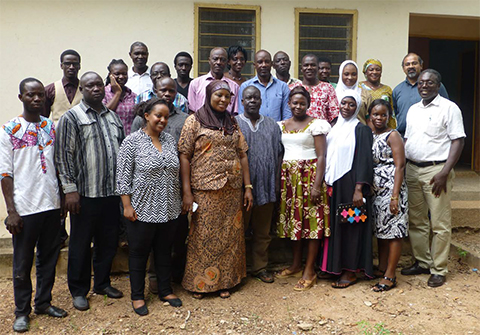
Subsequently, we held a two-day district workshop in Kumbungu town involving district managers from different sectors, including health, agriculture, education, environmental health, and water works. Staff from USAID/Resiliency in Northern Ghana (RING) and USAID/Systems for Health projects were also invited. The district workshop included a mix of didactic lectures, facilitated use of the tool by participants, group work in select teams, and multiple discussions with the whole group.
During the workshop, district-level participants provided information to populate the tabs of DATA then used the outputs from the tool to identify a list of prioritized anemia interventions, by sector. They completed this activity in groups comprising members from different sectors. Each of the groups focused on one sector corresponding to the sector pages of DATA's output, namely nutrition, disease control, water and sanitation, family planning, and agriculture.All the participants then discussed the list of interventions for each sector. The participants also provided feedback on the usefulness of DATA to the discussions on prioritization. We collated and qualitatively analyzed feedback from both the regional and district-level workshops.
Findings
Regional workshop participants unanimously approved of the design of the tool. Regional officials pointed out that policies for school health, health insurance, and gender were not included, nor were questions regarding the social and behavior change component of the interventions. They also indicated their interest in how DATA would feed into existing systems for health information. Overall, officials noted that the tool would be a useful aide in anemia planning.
Feedback from the district-level workshop was also positive. Comments on design and usability were primarily aesthetic, and participants appreciated the presentation of the tool's outputs. Feedback about content mainly related to the wording of the indicators, which did not always match the wording in Ghana's health information system.
In the regional and district workshops, and in workshop evaluations, participants expressed concern that the questionnaires were too lengthy. They also requested additional guidance on standardization of the qualitative classifications that are allowed in the tool, i.e. the use of opinions in the absence of quantitative information. The various sectoral groups that carried out the prioritization exercise stated that the tool was a useful aide, even in situations where data were limited. They further opined that prioritization was made easier by the pre-defined list of interventions in the tool, which helped the users organize their priorities.
Summary
Three main findings emerged from the testing of DATA in Ghana:
The field test demonstrated that DATA meets its objective to increase awareness about the multi-factorial causes of anemia and the need for a multi-sectoral effort to prevent and control it. Using the tool and analyzing the outputs allowed participants to appreciate the multi-faceted nature of anemia and the benefits of an integrated multi-sectoral action plan to control and prevent anemia.
DATA output is useful to prioritize anemia action, but additional input—including on logistics, demand, compliance, and general program operations—is needed.
There is a need to customize the tool to each district's context. This has to be balanced with the need for broad applicability of the tool across different districts in different countries. The National and District Questionnaires include questions that are broader, and not necessarily reflective of each district's situation. As part of the facilitation of the tool, participants of district-level workshops should be encouraged to create a customization table where differences between the indicator questions asked in the tool and indicators collected at the local level are noted. Participants should be referred to this customization sheet when they engage in prioritizing anemia interventions.
Next Steps
Based on feedback from the field testing, as well as input from the DATA Advisory Board, SPRING is revising the tool. The main revisions include shortening the length of the District Questionnaire, including the education sector among the questions, and incorporating instructions on customization in the facilitation guide. We are also developing the following resources to accompany the DATA tool: (1) a Facilitation Guide, to be used by the facilitator at the district-level workshop; (2) a User Guide that describes the structure and various elements of the tool, and includes instructions on how to navigate the tool; and (3) Pre-workshop materials to be distributed to the participants prior to the workshop. These materials lay out expectations of workshop participants, and details of the data that participants are expected to bring. The revised version of the tool will be used in three districts in the Northern region in Ghana in FY16.
Background
Anemia is a major public health problem. Globally, it is estimated that anemia affects 43 percent of children under age five, 29 percent of non-pregnant women, and 38 percent of pregnant women. Anemia is most widespread in Central and West Africa, where 71 percent of children under age five, 48 percent of non-pregnant women, and 56 percent of pregnant women suffer from anemia (Stevens et al. 2013). In Ghana, the overall prevalence of anemia is 66 percent among children age 6–59 months and 42 percent among women of reproductive age (Ghana Statistical Service, Ghana Health Service, and ICF International, 2015).
Anemia is a complex condition with many direct and indirect causes. Poor nutrition (including inadequate iron, vitamin A, folic acid, vitamin B12, and zinc intake), infections (malaria, helminthic infections, and chronic infections like HIV and tuberculosis), and genetics (thalassemia and sickle cell anemia) directly influence anemia status. Several types of health interventions can impact anemia prevalence. These include dietary interventions at the household level to increase the variety and quantity of micronutrient-rich foods, infant and young child feeding (IYCF) practices including exclusive and continued breastfeeding and appropriate complementary feeding, and water, sanitation, and hygiene interventions to reduce environment-induced inflammation in the body (Balarajan et al. 2011).
Due to the complexities of anemia causality, as well as the need to strengthen data and decision-making processes at the sub-national level as health systems increasingly decentralize, progress to accelerate the reduction of anemia has been slow, despite sound national policies that exist in many countries. Program managers who must prioritize among available anemia control and prevention interventions typically have limited access to district-level data, and even when such data exist, they face challenges in determining the relative contribution of each of the causes within populations and individuals. An approach to prioritizing interventions is to identify risk factors for anemia in a specific population and assess the adequacy of current programming to address these factors.
Anemia prevention efforts require synergy between nutrition-specific and nutrition-sensitive interventions. Nutrition-specific interventions such as dietary interventions, IYCF, supplementation, and fortification are best addressed by the health sector, while nutrition-sensitive interventions are conducted within the agriculture, education, and social welfare sectors, and some public health departments like reproductive health and water and sanitation . Because the causes of anemia span many different programmatic areas, a variety of district-level interventions across sectors are used to reduce its prevalence.
The SPRING project works globally to improve the quality of anemia-related data that are collected, analyzed, and used. Improved data strengthen the ability of multi-sectoral, multi-stakeholder groups to make evidence-informed decisions when promoting, planning, implementing, and monitoring anemia-related programs. To support this work, SPRING has developed a District Assessment Tool for Anemia (DATA) to assist countries in strengthening anemia programming at the district level. The DATA tool is intended to help district-level program managers and planners determine the main factors that cause anemia, identify enablers and barriers to addressing anemia, and prioritize interventions to combat it. It is our hope that DATA will also lead to more widespread awareness in the districts about the multi-sectoral, multi-factorial nature of anemia.
The purposes of DATA are to (1) increase understanding among district-level personnel about anemia and its causes; and (2) guide an analytic process to help prioritize activities and interventions most likely to address the most important local causes of anemia. The target audience for DATA is district-level government officials from multiple sectors. Because participants represent different sectors, they will come away from the district workshop with a better understanding of how sectors other than their own contribute to anemia prevention.
DATA is a Microsoft Excel-based tool that presents information in multiple tabs. In addition to the overview tab, DATA includes a tab where national-level information on anemia policies is entered into a National Questionnaire and a tab where district-level information is entered into a District Questionnaire. The District Questionnaire includes questions about disease prevalence, program coverage information, and barriers to program implementation. The tool also includes an option to include subjective opinions from district officials about disease burden and program coverage when no validated data is available.
DATA output is presented in multiple tabs, which include an overview of national, regional, and district-level anemia prevalence data together with the prevalence of risk factors. Separate tabs for nutrition; disease control; family planning; water, sanitation, and agriculture display information about the status of various anemia-related interventions. The output in the tabs is meant to help the user prioritize anemia interventions.
We are revising this version of DATA by incorporating feedback from the field testing in Ghana. The Ghana Health Service (GHS) selected Kumbungu district in the Northern region in Ghana as the pilot site for testing the usability, design, content, and implementation challenges of DATA.
Methods
SPRING/Ghana and GHS chose to test DATA in the Northern region of the country, where anemia prevalence is particularly high for women of reproductive age (42 percent) and children under age five (66 percent). Kumbungu district was selected as the site for testing. Officials at the national, regional, and district level were consulted, including the head of nutrition, the regional nutrition officer, the regional director of health, as well as the directors of health, agriculture, education and environmental health in Kumbungu district. The GHS at the national level played a key role throughout this phase of the project, reviewing the tool and approving its testing in Kumbungu district. Field testing of DATA was carried out in Tamale (the capital of the Northern region) and Kumbungu town in Kumbungo district in July-August 2015.
Field testing DATA was completed in two steps. First, we engaged in "ground-truthing" at a half-day workshop at the regional level in Tamale. This was followed by a two-day district-level workshop in Kumbungu. The "ground-truthing" exercise evaluated the suitability of the tool to the local context from the perspective of regional officials. We chose this level because program managers at the regional level oversee more than one district, and are thus familiar with differences between districts. Since the tool is meant to be used across multiple districts, the ground-truthing provided feedback on usability and relevance to the overall Northern region. Regional workshop attendees included officials from the Regional Health Directorate; Regional Coordination Council; USAID/Agriculture; and the district-level Departments of Education, Environmental Health, and Water and Sanitation within the Ghana Health Service. The agenda and participant list are included found in Annex 1. SPRING shared several presentations focused on anemia, the multi-sectoral efforts for anemia prevention and control, and the rationale for creating DATA. A demonstration on the use of DATA followed.
The DATA workshop facilitators visited the district headquarters in Kumbungu before the planned district workshop to sensitize the directors of the Departments of Health, Agriculture, Education, Environmental Health, and Water Works to the rationale for and importance of the workshop. Facilitators stressed the importance of bringing all available data on anemia and anemia programs to the district workshop to make the DATA demonstration more informative, and allow use of the tool with real-time data. Facilitators also reviewed all available sources of data with the district health information officer.
A week after the sensitization visit, a two-day district workshop involving district managers from different sectors—including health, agriculture, education, environmental health, and water works—w as held in Kumbungu town. Staff from the USAID/Resiliency in Northern Ghana (RING) and USAID/Systems for Health projects were also invited. The agenda and participant list are included in Annex 2. The first day included presentations about anemia, multi-sectoral efforts for anemia prevention and control, and the rationale for the creation of DATA. The rest of the first day and the first session on the second day focused on a collaborative exercise during which participants entered their data into the tool.
These data included—
- anemia prevalence information from various population groups
- prevalence of risk factors for anemia
- coverage data for interventions related to anemia from different sectors, including—
- nutrition (supplementation with iron-folic acid)
- micronutrient powder and vitamins
- IYCF practices
- mass fortification of foods
- disease control (for malaria and helminthic infection)
- water, sanitation, and hygiene (safe water supply, water safety, hygiene, and improved sanitation)
- family planning (unmet need for family planning and contraceptives issued)
- agriculture (value chain development, dietary diversification, home gardening, and livestock breeding/animal husbandry programs).
Sources of data included the health management information system, the logistics management information system, programmatic reports, surveys, and other sources.
The second session of the second day led participants through a prioritization process. After data were input, facilitators asked participants to identify the main issues they considered before prioritizing any program. The participants listed the following 13 areas:
- funding
- human resources
- transport
- trend of cases/disease burden
- program coverage
- training needs
- absence of monitoring data
- target setting
- acceptability of interventions
- timing of interventions
- existing programs in the district
- expected outcomes
- expected impact.
Using these prioritized issues, and reviewing the output from the tool, participants divided into groups outlined in DATA—nutrition, disease control, water and sanitation, family planning, and agriculture—to prioritize anemia program action. Each group was led by a participant from that sector and comprised members from other sectors to ensure cross-sectoral discussion. Afterward, each group provided a list of prioritized sectoral interventions and detailed feedback on how DATA outputs were used to create the prioritized lists.
Feedback from participants from both workshops was recorded during workshop sessions, collated, qualitatively analyzed, and presented within the three domains of interest: design and usability, content, and implementation challenges of DATA. District-level participants were also invited to complete a workshop evaluation assessment that asked about the workshop objectives and the conduct of the workshop. This evaluation informed the guide for DATA workshop facilitators. The workshop evaluation form is included in Annex 3.
Findings
Feedback from Regional Workshop
Feedback from regional workshop participants was recorded during the half day workshop when facilitators presented the DATA concept and demonstrated use of the tool itself. Regional officials in health information and health promotion departments expressed an interest in obtaining a copy of DATA. The feedback is presented with selected narrative quotes from participants.
Design and Usability
When asked, participants unanimously approved of the design of the tool. There were no comments on usability, as participants did not use the tool by themselves.
Content
- One participant suggested considering broader policies for school health, health insurance, and gender.
One participant suggested including questions regarding social and behavior change components of the interventions.
WASH has a huge behavior change component. The building of facilities does not have any meaning if people don't use the facilities.
There was concern about how DATA may feed into existing systems for health information:
How will the DATA and DHIMS be married, to avoid duplication? People are overwhelmed with data collection and program implementation—how do they get all this information to feed into this DATA? How long does it take to complete DATA?
The DHIMS is online, with more or less similar questions as DATA. The information comes from the facility level, which is entered in the system. Data is collected through the DHIMS, but districts have to actually sit down and look at the data! And they have to look for solutions to improve indicators. So DHIMS and DATA are to be looked at them side by side. When districts are sitting down and assessing their performance, they can pull out DATA to guide the conversation.
Implementation of DATA
There were requests for additional guidance to standardize the qualitative classifications that are allowed in the tool, e.g. the use of opinions in the absence of quantitative information.
If the tool is used, say quarterly, there should be consistency for the qualitative categorizations, from one quarter to the next.
There were some questions regarding the different ways that DATA could be used:
Can districts only use parts of the tool, if they determine that certain areas are doing very well and don't require much further improvement? Can they use part of the tool but not the whole tool?
If there are three districts with similar characteristics—can they combine efforts and get it done faster?There were questions regarding the translation of dashboard outputs into action:
The major piece of this tool is probably the dashboard—it provides a picture. What I struggle with is this: I have the snapshots in front of me; the tool paints pictures for nutrition, family planning, etc. How do I go about improving the picture? How do I translate this complex picture into action? These pictures have so much information in them. What am I walking away with?
Feedback from District Workshop
We recorded feedback from district-level workshop participants during various sessions, including when participants completed data entry, during the analysis of outputs in the small groups that carried out the prioritization exercise, during the final presentation of priority actions. Participants also provided feedback through evaluation forms. Overwhelmingly positive, feedback from the participants will inform upcoming revisions to the tool. Feedback is presented below with selected narrative quotes from participants.
Design and Usability
- Participants indicated it was difficult to read the content with light background colors on the screen and suggested the use of darker hues to improve readability
- Participants suggested that the word limit in the 'comment' sections be increased to ensure that all words are displayed in the dashboard.
- Participants identified two glitches: the absence of data for some indicators shows up as zero, when it should show up as 'NA' in the dashboard; and some skip pattern questions are not automatically blanked out.
- Participants suggested that the equations that drive the tool be hidden, if possible, for aesthetic reasons.
Content
- Participants thought that the education sector needed to be separated into its own tab.
- There were inconsistencies between the data that participants brought to the workshop and the indicators listed in the tool:
- Prevalence of anemia in women of reproductive age is not collected at the district, so prevalence of anemia in pregnant women was used as a proxy.
- For children under age five, anemia prevalence included only confirmed clinical cases from district hospital records. The participants did not use this information, and instead based their estimates on Demographic and Health Survey data for the Northern region.
- Water Works and WASH managers presented differing coverage rates of water interventions in the district. The two groups arrived at a consensus after discussion.
Participants from the agriculture sector suggested rephrasing questions about home gardening in the Agriculture section to include alternative possibilities:
During rainy seasons, people do not cultivate home gardens but instead farm near a water point, in a farm. Thus… rephrase the question so that it incorporates both home gardens and farms, instead of just home garden.
Implementation of DATA
- Participants requested additional guidance to standardize the qualitative classifications to be used in the absence of quantitative data.
There was an overall appreciation for the use of the qualitative categorization option, but there was a reluctance to view it as a rigorous method for assessment:
Qualitative analysis is good but we want figures; figures are more powerful. Figures help us plan.
The tool presents potential interventions at the district level; there is a need for facilitation to guide participants through incorporating the output from the tool into their decision-making:
One challenge—we didn't have enough data for the tool. But the tool helped in showing us that districts have some interventions that are being implemented, even though the data wasn't adequate.
It's from the tool that we were able to select the interventions—the data we put in enabled us to select what the problem is, what we should focus on.
Feedback from Session on Prioritization of Anemia Interventions
Participants made several important comments during the prioritization exercise:
- The lack of data made it difficult to prioritize, but DATA users were made aware of the gap in data and other evidence.
- Participants recognize that the prioritization decision depends on external factors beyond those presented in the tool. These include information related to related to logistics (adequate and consistent supply of the commodity required for the intervention); demand (awareness and interest about the intervention in the target population); compliance (the percentage of the target population practicing the intervention correctly); and general program operational issues like funding, incentives, and quality of service. These factors were highlighted in discussions among small groups when they were creating prioritized lists of anemia interventions by sector.
- Having a pre-defined list of interventions in the tool helped the users organize their priorities.
District Workshop Evaluation
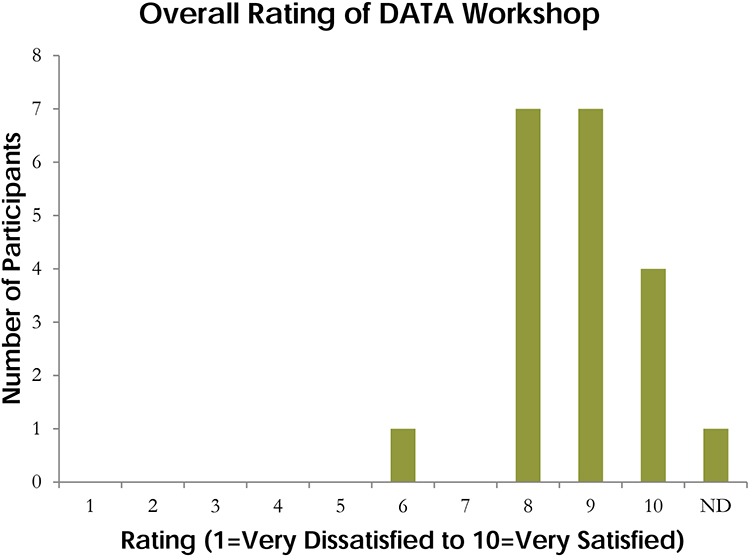
Evaluation results indicate that95 percent of participants understand the multi-factorial causes of anemia, 85 percent understand the importance of context-specific, multi-sectoral approaches to successfully address anemia, and 80 percent know how to use DATA to prioritize district-level anemia prevention and control programs. The median rating for the overall workshop was 9, out of a total of 10. Figure 1 shows all participant ratings.
Figure 1: Participant Ratings
Participants also provided feedback on the conduct of the workshop. The evaluation domains, and some of the illustrative comments, are presented below.
DATA increased awareness of anemia causes and the means to address them:
Understanding the multi-factorial causes of anemia and the relevance of the multi-sectoral approaches to successfully address anemia. It helps us to have data especially all the data in one point just like it is in the tool.
The value of collaborating across multiple sectors:
Data shared during the workshop was very useful in helping prioritize activities aimed at addressing anemia in Kumbungu due to the fact that different departments have been brought together to share ideas. For so doing, issues that could have been missed out have been captured for future planning.
The organization of the workshop:
[I truly appreciated] the interactive and educational nature of it.
The positives:
No answer was wrong. Everybody's opinion was respected.
The group discussion made everyone in the group contribute to the program.
What I like about the tool is the fact that when data is inputted, it easily generates where you are! So that interventions can be implemented to address the problem.The negatives:
It was short and caused more activities to be crammed within two days.
The cumbersome nature of the tool. In my opinion, I think it should have built up upon the existing tool cross sectoral departments already use.
I personally think the various stakeholders should have the questionnaires before the program and also before dealing with each of the thematic areas.
Summary
Three main findings emerged from the field testing of DATA in Ghana:
- The field test demonstrated that DATA meets its objective to increase awareness about the multi-factorial causes of anemia and the need for a multi-sectoral effort to prevent and control it. DATA is an excellent platform to increase awareness of the causes of anemia and the means to address them. Using the tool and analyzing the outputs allowed participants to appreciate the multi-faceted nature of anemia and the benefits of an integrated multi-sectoral action plan to control and prevent anemia.
- DATA output is useful to prioritize anemia action, but additional input, including logistics, demand, compliance and general program operations information, is needed.
- There is a need to customize the tool to each district's context, but this has to be balanced with the need for broad applicability of the tool across different districts in different countries. The National and District Questionnaires include questions that are broader, and not necessarily reflective of each district's situation. As part of the facilitation of the tool, participants of district- level workshops should be encouraged to create a customization table where differences between the indicator questions asked in the tool and indicators collected at the local level are noted. Participants should be referred to this customization sheet when they engage in prioritizing anemia interventions.
Additionally, throughout the organization of the workshops and the testing of the tool, SPRING documented its own important lessons learned. As DATA testing continues in other settings and enters the roll-out phase on a larger scale, the following lessons are pertinent for successful implementation:
- Involve the government at all levels: SPRING/Ghana stressed the need for a district-level decision- making tool, and requested the Government of Ghana to test the DATA tool for that purpose. Communication and close collaboration with government officials, including GHS personnel, was of utmost importance in moving this project forward. GHS played a particularly important role in reviewing and approving the tool for the testing in Kumbungu District.
- Prepare the provincial (or state or regional) and district government ahead of time: SPRING/Ghana created pre-workshop information sheets to send to regional and district officers. For regional officials, the information sheets included discussion about DATA and expectations for the workshops. For district officials, the information sheets identified the kinds of data inputs that were needed for the tool, and requested that invited officials bring all relevant data to district workshop.
- At the provincial/state/regional workshop, present the tool during the workshop and make it available to all participants after the workshop: Given the competing priorities for regional officials' attention, SPRING made the tool available for sharing to those who expressed interest. We received queries from the regional officer in charge of information systems and the regional nutrition officer.
- Ensure a district presence: In each of the 15 districts where it works, SPRING/Ghana had employed a team comprised of a district officer and district coordinator to liaison with government district officials for program implementation. The SPRING district team was instrumental in priming district officials about the workshop, and their mention of the DATA tool at multiple contacts helped ensure almost full participation during the district workshop.
- Conduct pre-workshop visit in the district to meet with invited officials: A few days before the district workshop, the SPRING team (both DC and Ghana, accompanied by the Kumbungu District team) met with the district directors of Health, Agriculture, Education, and Environmental Health sectors in Kumbungu District to refresh them about the tool and its uses. The team clarified last minute queries about the workshop from the various departments.
- Outline the objectives of the workshop and the expectations from the participants clearly: During the pre-workshop visit and throughout the workshop, we stated, and reiterated, the objective of the workshop, which was to seek participants' feedback on the tool.
- Identify what the district needs in terms of inputs for decision making, and identify areas where the use of DATA can assist in this prioritization process: Most of the second day of the district workshop was dedicated to conducting a simulated decision-making process. SPRING created a decision-making framework to accompany the tool but also wanted the tool to fit in with the participants' decision-making process for prioritization of anemia action. SPRING outlined areas of importance for decision making and, during the simulated session, asked participants to identify areas where the DATA tool could be used.
- Before presenting SPRING's decision-making framework, spend time charting the district officials' decision-making framework, even if they do not explicitly follow one, and subsequently try to draw linkages between the two frameworks.
- Attempt to customize the district-level questionnaire to be more user-friendly for workshop participants. This can be accomplished by using indicators that they are familiar with, and use, on a regular basis. Insist on pre-defined indicators only if the absence of these indicators would hinder important discussions.
Next Steps
- Feedback from the DATA field testing in Ghana was presented to the DATA Advisory Group. Based on feedback from the field testing participants and inputs from the DATA Advisory Board, the tool was revised by SPRING. The following changes were made to the tool:
- The length of the district questionnaire has been reduced to 45 questions.
- There is a new section in the facilitation guide which provides instructions on customization of the tool to the local context. This is a customization table that will be created by the note taker during the course of the workshop, using the template provided. The table will be used to record any changes to the questionnaire in terms of the indicators for anemia, anemia risk factors, and coverage of anemia intervention. Any other discussion points related to each of the specific questions will be recorded in the table as well. These include, but are not limited to, supply chain issues for commodities used in various interventions, and barriers to implementation of various interventions.
- The new Findings Dashboard presents information on interventions from all of the sectors in color-coded boxes on one page.
- Education has been included as its own sector, and two interventions – mass deworming of school children and promotion of hygiene education in schools – have been included in the list of interventions.
- Questions about the existence of sectoral policies and intervention programs have been represented with icons instead of words.
- Since participants reported that the graphs were powerful, the new graphics present information on interventions that have direct impact on anemia – iron-folic acid supplementation, malaria prevention and treatment, and mass deworming.
- The tool has been formatted to be printable on A4 size print paper, which is the standard for most printers around the world.
- SPRING has also developed the following resources to accompany the DATA tool:
- Facilitation Guide, to be used by the facilitator at the district-level workshop;
- User Guide, which describes the structure of the tool as well as the various elements of the tool, and includes instructions on how to navigate the tool;
- Pre-workshop materials to be distributed to the participants prior to the workshop, which lay out expectations of workshop participants, and details of the data that the participants are expected to bring.
- The revised version of the tool will be used in three districts in the Northern region of Ghana in FY16.
References
Balarajan, Yarlini et al. 2011. "Anaemia in Low-Income and Middle-Income Countries." Lancet 378 (9809): 2123–35. doi:10.1016/S0140-6736(10)62304-5.
Ghana Statistical Service (GSS), Ghana Health Service (GHS), and ICF International. 2015. "Ghana Demographic and Health Survey 2014." Rockville, Maryland, USA: GSS, GHS, and ICF International.
Stevens, Gretchen A. et al. 2013. "Global, Regional, and National Trends in Haemoglobin Concentration and Prevalence of Total and Severe Anaemia in Children and Pregnant and Non-Pregnant Women for 1995–2011: A Systematic Analysis of Population-Representative Data." The Lancet Global Health 1 (1): e16–25. doi:10.1016/S2214-109X(13)70001-9.
Stoltzfus, Rebecca J., Luke Mullany, and Robert E. Black. "Iron Deficiency Anaemia." In Comparative Quantification of Health Risks: Global and Regional Burden of Disease Attributable to Selected Major Risk Factors Vol. 1, edited by Majid Ezzati, Alan D. Lopez, Anthony Rodgers and Christopher J.L. Murray, 163-209. Geneva: WHO, 2004.