Rainy and Dry Seasons
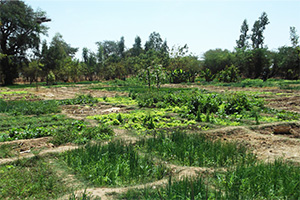
SPRING/Mali’s goal is to improve the nutritional status of women of reproductive age, pregnant and lactating women, and children under age two in the Mopti region. To address this goal, we promoted the adoption of essential nutrition actions and essential hygiene actions (ENA/EHA), improved health services, and worked to increase the availability and consumption of nutritious and diverse diets.
To achieve improved nutritional outcomes, we pursued three primary objectives:
- Objective 1: Increase access to diverse and quality foods
- Objective 2: Increase access to quality nutrition services
- Objective 3: Increase demand for key agriculture, nutrition, and water, sanitation, and hygiene (WASH)-related practices and services.
Methodology
Data collection tool
Over seven days in late January, 2016, trained SPRING field agents administered a survey to randomly selected project beneficiaries to inform project achievements for key Feed the Future (FTF) indicators. The survey is divided into two sections. The first section focuses on the rainy season from July to October 2015, while the second asks about the dry season from November 2015 to March 2016.
We include results for the following FTF indicators based on survey findings, in this report:
(1) FTF indicator 4.5(16): Gross margin per hectare;
(2) FTF indicator 4.5.2(2): Number of hectares of land under improved technologies or management practices as a result of U.S. Government (USG) assistance;
(3) FTF indicator 4.5.2(23): Value of incremental sales (collected at farm-level) attributed to FTF implementation;
(4) FTF indicator 4.5.2.8 (TBD3): Total value of targeted nutrient-rich value chain commodities set aside for home consumption by direct beneficiary producer households;
We also estimated, by mathematical calculation, SPRING achievements for the following indicator:
(5) FTF indicator 4.5.2(14): Number of vulnerable households benefiting directly from USG assistance.
Sampling
SPRING randomly sampled 127 of its 5,500 Farmer Nutrition Schools (FNS) beneficiaries, stratifying the study sample by type of membership (FNS leader or FNS member). Farmers were selected from each of the four cercles in Mopti where SPRING established FNS. Over 95 percent of FNS beneficiaries are women, which is reflected in the study sample, although we oversampled men to allow for gender-disaggregated results from the data. Table 1 shows the sampling breakdown by membership and commune.
Table 1: Survey sample by FNS membership and commune
| Commune | FNS leaders | FNS members | Total |
|---|---|---|---|
| Koro | 25 | 26 | 51 |
| Bankass | 23 | 25 | 48 |
| Mopti | 9 | 11 | 20 |
| Badiangara | 3 | 5 | 8 |
| Total | 60 | 67 | 127 |
Results
In this section, we summarize findings for gross margin per hectare, hectares of improved technologies or management practices, incremental sales, home consumption of nutrient-rich value chain commodities, and vulnerable households benefiting from project assistance.
Gross Margin per Hectare
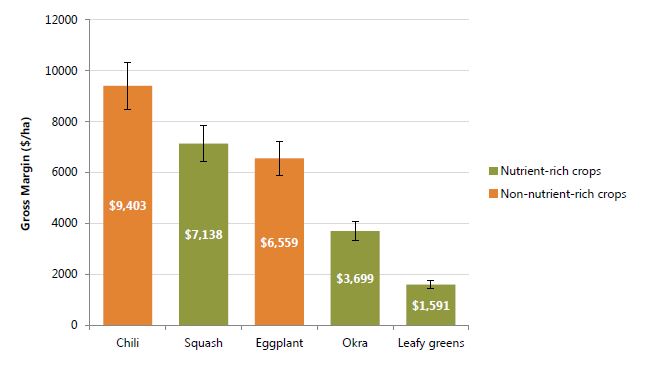
During the first Project Year (PY1), SPRING promoted the production and consumption of specific nutrient-rich crops through FNS established throughout the Mopti region, which reached a total of 5,500 beneficiaries. These nutrient-rich crops included squash, okra and leafy greens. Of these, squash had the highest gross margin, at $7,138 per hectare, while okra and leafy greens (namely potato, cowpea and sorrel leaves) yielded considerably lower gross margins, at $3,699 per hectare and $1,591 per hectare, respectively. SPRING beneficiaries also grew chili and eggplant widely during the rainy season, but these crops do not qualify as nutrient-rich. We found that chili had the highest gross margin of all crops, at $9403 per hectare, while eggplant yielded a gross margin of $6,559 per hectare.
Figure 1 illustrates these results, with the height of the bars representing the sample mean for gross margin per hectare for each crop during the rainy season. We display 10 percent margins of error associated with these findings as well.
Figure 1: Gross margin per hectare reported by SPRING beneficiaries during the rainy season
Detailed tables showing disaggregated information required to calculate gross margin are available in Annex 1. For each crop, the tables list the five data points required for entry into the Feed the Future Monitoring System (FTFMS), which include: a) total production by direct beneficiaries during reporting period; b) total value of sales by direct beneficiaries during reporting period; c) total quantity (volume of sales) by direct beneficiaries during reporting period; d) total recurrent cash input costs of direct beneficiaries during reporting period; and e) total units of production.
Few farmers had harvested and none had sold their yields for the cold, dry season at the time of data collection in late January. We are therefore unable to calculate the gross margin, incremental sales and nutrient-rich value chain commodity set aside for home consumption indicators for the dry season.
Hectares of land under improved technologies or management practices
As part of the FNS curriculum, SPRING organized training sessions in PY1 promoting specific improved technologies and management practices. These included cultural practices, such as fencing and timing of harvest; pest management, including treatments with natural insecticides; soil-related fertility and conservation, including composting; and irrigation, including manual and rain irrigation. During the rainy season, 88 percent of all SPRING beneficiaries planted crops around their home to take advantage of available water, while 67 percent farmed in community gardens. SPRING beneficiaries applied one or more improved technologies/management practices on a total of 134 hectares of land during this rainy season. Cultural practices, soil-related fertility and conservation, and irrigation were applied almost universally (133, 132, and 133 hectares of land, respectively), while improved pest management practices covered 111 hectares.
I’ve learned better, more efficient ways to garden, and I’ve been able to share the techniques with FNS members in my village. We are all so proud of our compost pits, and we’ve had a great harvest thanks to it.
—Mariam Goindo, FNS leader
During the cold, dry season, significantly fewer farmers (12 percent) planted around their home as sufficient water is no longer available. Activity in the community gardens, on the other hand, diminished only slightly, with 56 percent of farmers planting in the dry season compared with 67 percent during the rainy season. Farmers implemented one or more improved technologies or agricultural management practices on a total of 31 hectares. Specifically, farmers applied cultural practices, pest management, soil-related fertility and conservation, and irrigation nearly universally: 31 hectares for cultural practices and irrigation, and 29 hectares for soil-related fertility and conservation and pest management.
Table 2: Improved technologies/management practices reported by SPRING beneficiaries
| Baseline | Rainy season (ha) | Dry season (ha) | |
|---|---|---|---|
| Technology type | |||
| Cultural practices | 0 | 133 | 31 |
| Pest Management | 0 | 111 | 29 |
| Soil-related fertility and conservation | 0 | 132 | 29 |
| Irrigation | 0 | 133 | 31 |
| Total w/ one or more improved technology | 0 | 134 | 31 |
| Sex | |||
| Male | 0 | 7 | 1 |
| Female | 0 | 127 | 30 |
Value of incremental sales (collected at farm-level) attributed to Feed the Future implementation
During the rainy season, baseline sales for the rainy season were as follows: $82,432 for squash (1,386 farmers); $75,050 for okra (2,212 farmers); $1,374 for leafy greens (260 farmers); $105,200 for peppers (1,083 farmers), and $31,942 for eggplant (1,039 farmers). These values, seen below in Table 3, will serve as a baseline when comparing future sales.
Table 3: Rainy season sales reported by SPRING beneficiaries
| Crops | Rainy season total sales (USD) | Quantities sold (kg) | Number of beneficiaries |
|---|---|---|---|
| Squash | 82,432 | 273,071 | 1386 |
| Okra | 75,050 | 192,844 | 2212 |
| Leafy greens | 1,374 | 6,518 | 260 |
| Chili peppers | 105,200 | 91,323 | 1083 |
| Eggplant | 31,942 | 141,625 | 1039 |
Total value of targeted nutrient-rich value chain commodities set aside for home consumption
During the rainy season, the majority of SPRING beneficiaries set aside their entire agricultural yields for home consumption, while the remainder chose to sell a portion of their yields and keep the rest. For instance, among the 94 percent who planted okra, 57 percent set aside all of the agricultural yields for home consumption, while the remaining 43 percent sold some portion of it. Fewer farmers (59 percent) grew squash during the same period, but similar to okra, 57 percent of them kept their entire yield for home consumption while the rest sold some quantity in the market. Leafy greens were a less popular crop, with only 36 percent of farmers growing them, and 87 percent keeping their entire agricultural yield for home consumption.
This rainy season was my first time planting squash. I wanted to try my hand at squash because I’ve learned that it is good for my and my family’s health. I ended up with 40 squash after harvest!
—Mauam Dougnon, FNS member
Farmers kept 56 percent (351,008 kg) of all squash produced during the rainy season for home consumption. Farmers set aside a total of 59 percent (281,230 kg) of all okra produced for home consumption, while they set aside the vast majority of leafy greens—90 percent 58,657 kg—to consume in the home. Per household, farmers who harvested these crops set aside an average of 108kg of squash, 54 kg of okra, and 29 kg of leafy greens for home consumption during the rainy season. Table 4 shows these results in greater detail.
Table 4: Nutrient-rich Commodities Set Aside for Home Consumption by SPRING Beneficiaries
| Crops | Total quantities consumed (kg) | Number of beneficiaries |
|---|---|---|
| Squash | 351,008 | 3248 |
| Okra | 281,230 | 5197 |
| Leafy greens | 58,657 | 1992 |
Number of vulnerable households benefiting directly from USG assistance
SPRING's multiple interventions overlap considerably to establish repeated contact with individuals, with the ultimate goal of changing key agriculture, nutrition, and WASH-related behaviors. In order to avoid double counting households reached by various interventions, SPRING selected the two most widespread of its interventions to estimate the number of households reached: number of households in villages declared open defecation free (ODF) and, for villages that were not declared ODF, number of households targeted and reached by community health workers with repeated in-depth discussions around Essential Nutrition Actions (ENA) and Essential Hygiene Actions (EHA). Beneficiaries of other activities, such as FNS, are accounted for in this calculation, given that they participate in ENA/EHA discussions led by community health workers.
Using these criteria, we calculated that vulnerable households are 55 percent of all households reached, bringing the total to 19,731 vulnerable households benefiting directly from SPRING assistance in the Mopti region during the life of the project.
Discussion
The survey shed light on project achievements and established baseline values for specific FTF indicators. We found that uptake of improved technologies and management practices was high among SPRING beneficiaries, who applied these techniques on a total of 134 and 31 hectares of land during the rainy season and the dry season, respectively. Farmers primarily used agricultural yields for home consumption, with 57 percent keeping their entire squash and okra harvest for home consumption and 90 percent doing the same for leafy greens. Gross margin and baseline sales have been established, and can serve as comparison points for future accomplishments. Overall, 19,731 vulnerable households benefited directly from SPRING assistance.
During FNS, I learned that squash and okra are very nutritious foods, so I planted more of these crops during the rainy season. I kept most of the harvest for my family to eat and grow healthy. Now that I’m aware of the benefits associated with eating squash and okra, I don’t want to take my harvest to the market.
—Atta Djija Togo, FNS member
To view the annex, please download the full report above.