This SPRING regional profile provides an overview of early life nutrition status and later life nutrition-related noncommunicable diseases (N-RNCDs) in Africa.1 The profile also provides context to the national and sub-national analyses presented in the SPRING country profile series on the same topic.
Evidence has been mounting to support the hypothesis that maternal undernutrition, as well as in-utero infant and young child undernutrition, are correlated with the risk of developing N-RNCDs later in life (Barker, 1992 and Gluckman, 2010). From the data available, the Africa region currently shows a comparatively low current burden of N-RNCDs relative to other regions, but the burden of pre-NCDs such as hypertension and overweight is higher than average relative to other regions. This could increase the burden of N-RNCD conditions during the years to come if calorie availability increases, particularly when compounded with high rates of low birth weight and stunting. The Africa region is also quite large and heterogeneous, with some sub-regions carrying much higher burdens than others. The current status and recent trends related to N-RNCD risk and prevalence are shown in greater detail in the following sections.
Current Burden of N-RNCDs and Pre-NCD Conditions2
There are few data sources on actual prevalence of N-RNCDs such as Type II diabetes mellitus (diabetes) and cardiovascular disease (CVD), though according to the World Health Organization (WHO), these two diseases, along with cancer and other NCDs, account for around one-third of all deaths in Africa (calculated from WHO 2011). The data that have been estimated for prevalence of diabetes, depicted in Figure 1, show that while Africa overall does not have a particularly high rate of diabetes, there has been a steady increase over the ten most recent years of data. Looking at only low- and low-middle income (L/LMIC) countries in Africa, this trend and level is only fractionally lower. The range of diabetes prevalence is quite wide for this region, with the lowest figure being 5.9% in Burundi, and the highest being 14.7% in Cape Verde. Southern Africa seems to have the highest sub-region burden, with Swaziland and Lesotho both coming in at around 12%.
FIGURE 1: Trends In Diabetes Prevalence By Region, Women 25 and Older, 1999-2008
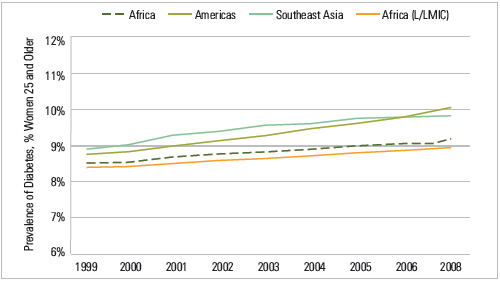
Source: Global Burden of Metabolic Risk Factor of Chronic Diseases Collaborating Group, accessed August 2012.
The prevalence of pre-NCD conditions, such as hypertension and raised cholesterol, have also been collected and/or estimated by WHO. The mean prevalence of these conditions for women are shown by income groups in Figure 2.
FIGURE 2: Mean Pre-NCD Prevalence, Women 25 and Older
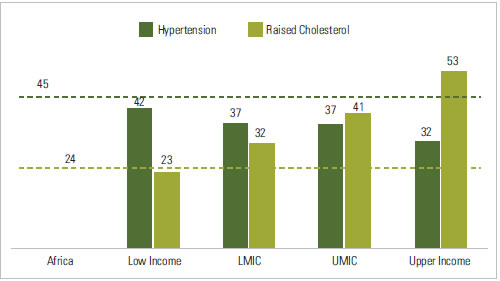
Source: Created using World Bank income and WHO region categorizations in data from Alwan, Ala, and WHO (2011).Population-weighted averages used, based on 2012 International Census Database population values.
By wealth, it appears that prevalence of female hypertension trends downward with country wealth, while prevalence of raised cholesterol goes up. The dotted line represents the average levels for the Africa region. Unsurprisingly, the regional averages most closely match with the averages for lower income countries, where hypertension prevalence is high and cholesterol prevalence is lower. However, when broken down by selected countries in Africa, we no longer see a consistent relationship between pre-NCD rates and wealth (See country profiles for country-specific values). Another pre-NCD condition, high body mass index (BMI), has a stronger relationship to country wealth (see Figure 3). Refer to the country profiles for more information on prevalence of overweight women and children by household wealth. In those sub-population breakdowns, weight appears to trend with wealth at the household level as well.
FIGURE 3: Percent of Women Overweight by Country Wealth, Women 15 to 49, Africa Region, Latest Year
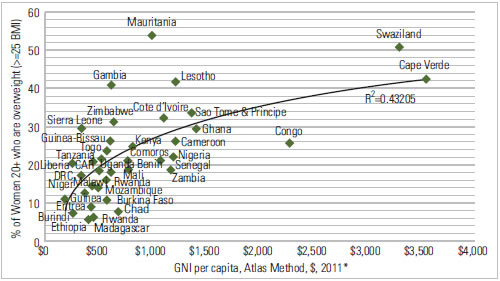
Source: Countries without a recent DHS (after 2006) use WHO women’s overweight figures, for women 20+. Countries with DHS figures are from latest year, for women 15-49.Wealth is defined as GNI per capita, Atlas method, US dollars, 2011 unless data not available, then 2008-2010. World Bank Indicator Database, accessed September 2012.
Overweight prevalence in adult women is provided by country in Figure 4. Prevalence ranges from a low of 6% in Ethiopia to a high of 53.9% in Mauritania. Four additional countries have averages higher than 40% – Cape Verde (42.6), Gambia (40.9), Lesotho (42) and Swaziland (50.6). This is as compared to 64% for women in the United States in 2010 (CDC, 2011). For African-American women only, the prevalence is 72%.
FIGURE 4: Prevalence of Overweight, Women 15 to 49, Latest Year
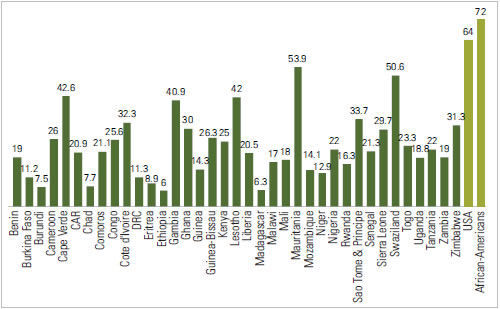
Source: Countries without a recent DHS (after 2006) use WHO women’s overweight figures, for women 20+. Countries with DHS figures are from latest year, for women 15-49.
Potential for Growth in Future N-RNCD Burden
The average prevalence of overweight in both women and children under five in the Africa region currently ranks in between the South & Southeast Asia (SSA) and Latin America & Caribbean (LAC) regions, both for overall averages and average among low and low-middle income countries. However, Africa is set to surpass LAC by 2020 for average child overweight (De Onis, Blossner, and Borghi, 2010). Figure 5 shows trends over time in stunted and overweight children for four UN Africa sub-regions. It is evident that while stunting will continue to be a larger issue, the prevalence is dropping quickly while overweight prevalence is growing in most regions. By sub-region, trends are quite varied. Southern Africa, which ranks highest for current NCD and pre-NCD burden, appears to be set for a decrease in child overweight prevalence, though there are large confidence intervals around this particular sub-region’s estimates. Middle and Western African regions appear to be on a fairly steep upward trajectory for overweight while simultaneously experiencing decreases in stunting.
FIGURE 5: Trends In Child Overweight And Stunting, Children Under Five, 1990-2020
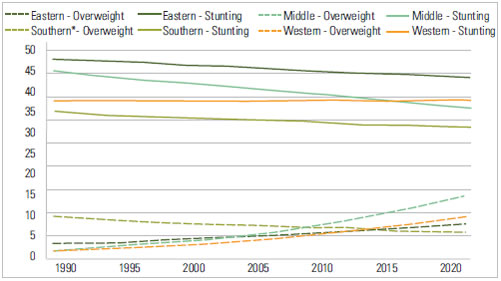
Source: De Onis, Blossner, Borghi 2010, De Onis, Blossner, Borghi 2011. UN Regions (not WHO Regions) were used in these papers, and therefore also in Figure 5. Country lists for these sub-regions can be found at: http://unstats.un.org/unsd/methods/m49/m49regin.htm#africa. Southern region data largely based on smaller scale surveys, and thus have much larger confidence intervals than the other African sub-regions listed.
Figure 6 shows national averages for overweight in children for the L/LMIC countries in Africa. While five countries have quite low rates of child overweight (Ethiopia, Burkina Faso, Senegal, Burundi, Cote D’Ivoire all have rates below 3%), the average rate is around 6%, and several countries have rates that rival developed country averages (Swaziland, Sao Tome & Principe, Benin, Nigeria, Sierra Leone, Malawi, and Zambia are all above 8%). As a comparator, the most recent survey of child overweight in the United States found 11% prevalence in those aged two to five years.
FIGURE 6: Prevalence of Overweight, Children under Five, Latest Year
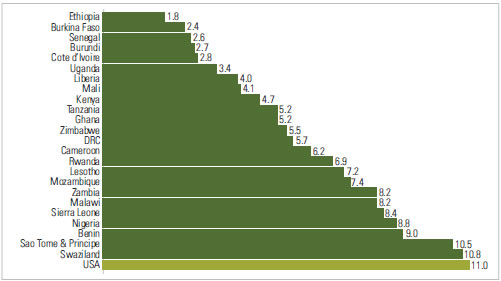
Source: Countries without a recent DHS use WHO child overweight figures, for children under five. DHS figures are also for children under five. The U.S. figure is from CDC, for children two – five years old. No data were available for either source for Cape Verde, CAR, Chad, Comoros, Congo, Eritrea, Gambia, Guinea, Guinea-Bissau, Madagascar, Mauritania, Niger, and Togo.
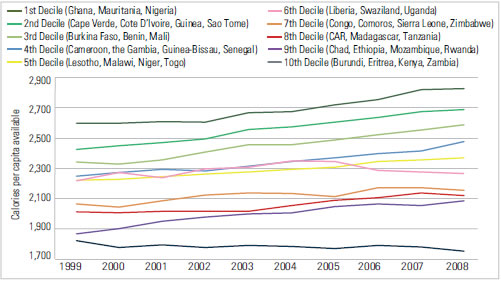
Currently, the Africa Region as a whole does not face a mature N-RNCD epidemic but does have generally higher prevalence of pre-NCD conditions such as overweight and hypertension than other regions. Within certain sub-regions, there are already alarming rates of both N-RNCD and pre-NCD conditions, such as Southern Africa and large parts if West Africa. In addition, many countries in these same at-risk sub-regions have high rates of low birth weight and burden of stunting (see country profiles as well as De Onis, Blossner and Borghi 2011, Kothari & Abderrahim 2010), two conditions that are associated with increased risk of developing N-RNCDs later in life (Barker, 1992 and Gluckman, 2010). As calorie availability becomes greater over time, these conditions could create a rapid growth in N-RNCDs beyond the age of five years. Figure 7 shows the trends over the last decade in calories per capita.
FIGURE 7: Trends in Average Calorie Availability by Decile, Africa Region, 1999-2008
Source: FAOSTAT database, accessed September 2012. Uses Crops Primary Equivalent method. No data available for Democratic Republic of Congo.
On average, the Africa region countries gained about 120 calories per capita over this time period. The biggest growth in calories per capita appear to be in the top (dark green), third (light green), and ninth (purple) deciles, which contain many of the same countries that appear to have higher risk of N-RNCD conditions. The bottom decile (navy) actually lost a few calories over this time period, reflecting that several of these countries have faced continuing food insecurity over the last decade. Trends for women’s BMI are shown in Figure 8 for the same time period. There is a fair amount of shifting of countries between deciles, indicating the different starting levels of female BMI and economic status of countries. In terms of growth in female BMI over time, the top two (darker green), fifth (yellow), and sixth (pink) gained more than 1 kg/m2 over this ten year period.
FIGURE 8: Trends in Mean BMI by Decile, Women 20 and Older, 1999-2008
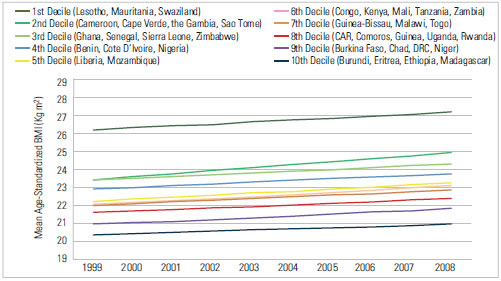
Source: Global Burden of Metabolic Risk Factor of Chronic Diseases Collaborating Group, accessed August 2012.
The bottom decile gained the least, just 0.58 kg/m2. Many other factors can affect both calories per capita and BMI, making them imperfect for tracking N-RNCD risk. Better, more explicitly collected methods will need to be developed to monitor growth in risk factors.
Conclusion
Based on current evidence, it appears that the Africa region has varied risk for N-RNCD growth, dependent on sub-region. Theprevalence of hypertension and female and child overweight is high and growing quickly in many countries, and the combination of high rates of low birth weight, stunting, and increased calorie availability may lead to a significant increase in N-RNCDs in this region over the next decade. Countries should begin to address this growing issue now in their health and nutrition strategic planning and budgeting process. They should also establish standards of care for common N-RNCD conditions, as was recommended by WHO at the 2008 World Health Assembly (WHO, 2010). More information on current child nutrition and potential future N-RNCD risk at the sub-national level can be found for several of these countries in individual country research briefs.
Definitions
Child Overweight: Weight for height Z score greater than +2 SD
Child Stunting: Height for age Z score less than -2 SD
Country Wealth: GNI per capita, Atlas method, US dollars.
Hypertension: Raised blood pressure (SBP>140 OR DBP>90 OR on meds)
Maternal Overweight: Body mass index greater than or equal to 25 kg/m2
Raised Glucose: Raised fasting blood glucose (> 7.0 mmol/L or on meds)
Raised Cholesterol: Raised total cholesterol (> 5.0 mmol/L)
Footnotes
1 For the purposes of these profiles, we define regions according to WHO. For detailed charts and figures we limit the data presented to only those countries in each region categorized as low income or low-middle income by the World Bank in 2011.
2 For DEFINITIONS of all terms used in this profile, please see below.
References
Alwan, A., World Health Organization, 2011. Global status report on noncommunicable diseases 2010. Geneva, Switzerland: WHO.
Barker DJB, ed. 1992. Fetal and infant origins of adult disease. London: BMJ Publishing Group.
CDC. 2011. CDC Health Data Interactive, for NHANES Data Round 2007-2010. Accessed 9/16/12.
De Onis, M., Blössner, M., Borghi, E., 2010. Global prevalence and trends of overweight and obesity among preschool children. Am. J. Clin. Nutr 92, 1257–1264.
De Onis, M., Blössner, M., Borghi, E., 2011. Prevalence and trends of stunting among pre-school children, 1990-2020. Public Health Nutr 1–7.
Gluckman PD, Hanson MA, Buklijas T., 2010. A conceptual framework for the developmental origins of health and disease. J DOHaD 1, 6–18.
Kothari, Monica and Noureddine Abderrahim. 2010. Nutrition Update 2010. Calverton, Maryland, USA: ICF Macro.
WHO, 2010. Package of Essential Noncommunicable (PEN) Disease Interventions for Primary Health Care in Low-resource Settings. Geneva, Switzerland: WHO.