This SPRING regional profile provides an overview of early life nutrition status and later life nutrition-related noncommunicable diseases (N-RNCDs) in South and Southeast (SSE) Asia.1 The profile also provides context to the national and sub-national analyses presented in the SPRING country profile series on the same topic.
Evidence has been mounting to support the hypothesis that maternal undernutrition, as well as in-utero and infant and young child undernutrition, are correlated with the risk of developing N-RNCDs later in life (Barker, 1992 and Gluckman, 2010). From the data available, the SSE Asia region currently shows a moderate burden of N-RNCDs and pre-NCD conditions relative to other regions, while an evolving environment of higher calorie availability could increase the burden during the years to come. The current status and recent trends related to N-RNCD risk and prevalence are shown in greater detail in the following sections.
Current Burden of N-RNCDs and Pre-NCD Conditions2
There are few data sources on actual prevalence of N-RNCDs such as Type II diabetes mellitus (diabetes) and cardiovascular disease (CVD), though according to the World Health Organization (WHO), these two diseases, along with cancer and other NCDs, account for around one-quarter to one-third of all deaths in SSE Asia (calculated from WHO 2011). The data that have been estimated for prevalence of diabetes, depicted in Figure 1, show that while growth of diabetes in SSE Asian countries has not been remarkable, it does in fact have one of the highest average prevalence rates of diabetes among adult women, only recently overtaken by the Americas region in 2007. Looking at only low and low-middle income (L/LMIC) countries in SSE Asia, this trend and level is only fractionally lower.
FIGURE 1: Trends In Diabetes Prevalence By Region, Women 25 and Older, 1999-2008
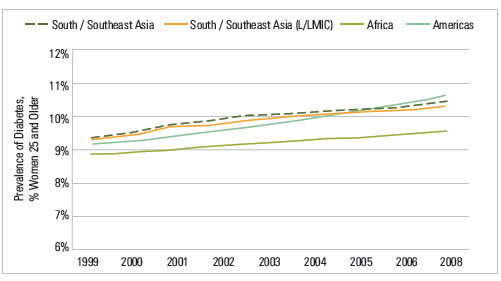
Source: Global Burden of Metabolic Risk Factor of Chronic Diseases Collaborating Group, accessed August 2012.
The prevalence of pre-NCD conditions, such as hypertension and raised cholesterol, have also been collected and/or estimated by WHO. The mean prevalence of these conditions for women are shown by income groups in Figure 2.
FIGURE 2: Mean Pre-NCD Prevalence, Women 25 and Older
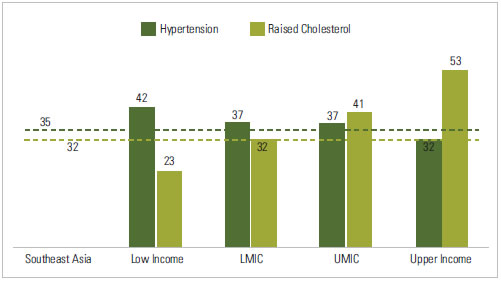
Source: Created using World Bank income and WHO region categorizations in data from Alwan, Ala, and WHO (2011).Population-weighted averages used, based on 2012 International Census Database population values.
By wealth, it appears that prevalence of female hypertension trends downward with country wealth, while prevalence of raised cholesterol goes up. The mean prevalence of these pre-NCD conditions in SSE Asia is shown by the dotted lines. SSE Asia prevalence most closely fits with the averages seen for LMIC countries. However, when broken down by selected countries in SSE Asia, we no longer see a relationship between pre-NCD rates and wealth (see country profiles for country-specific values). Another pre-NCD condition, high body mass index (BMI), has a stronger relationship to country wealth (see Figure 3). Timor-Leste is a major outlier; excluding this country increases the goodness of fit measure (R2) to over 75%.
FIGURE 3: Percent of Women Overweight by Country Wealth, Women 15 to 49, SSE Asia Region, Latest Year
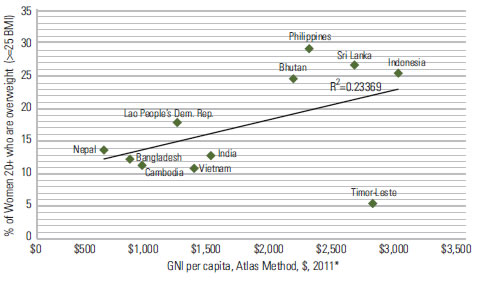
Source: Countries without a recent DHS (after 2006) use WHO women’s overweight figures, for women 20+. Countries with DHS figures are from latest year, for women 15-49.Wealth is defined as GNI per capita, Atlas method, US dollars, 2011 unless data not available, then 2008-2010. World Bank Indicator Database, accessed September 2012.
Refer to the country profiles for more information on prevalence of overweight women and children by household wealth. In those sub-population breakdowns, weight appears to trend with wealth at the household level as well.
Overweight prevalence in adult women ranges from a low of 5% in Timor-Leste to a high of 29% in the Philippines. This is compared to 64% for women in the United States in 2010 (CDC, 2011). While the United States does not report overweight figures for Asian- American women only, the prevalence for all Asian-Americans is 41%.
SSE Asia has the lowest mean prevalence of overweight women among all world regions, but this may be related to biological differences across ethnicities. As noted by the WHO expert consultation on appropriate BMI, increased risk for CVD and diabetes may occur at a lower BMI for certain Asian populations (WHO 2004). Considering this, Figure 4 presents prevalence of increased risk for four SSE Asian countries with DHS data to allow for this analysis. By using the increased risk BMI cutoff of 23, the percent of the population at risk of N-RNCDs nearly doubles.
FIGURE 4: Percent of Women with BMI Associated With Increased Risk of CVD and Diabetes, Women 15 to 49, Latest Year
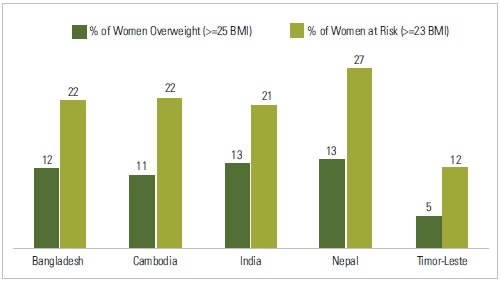
Source: Latest year DHS data, for women 15-49. DHS data not available for Bhutan, Indonesia, Lao People’s Democratic Republic, Myanmar, Philippines, Sri Lanka, Vietnam.
Potential for Growth in Future N-RNCD Burden
SSE Asia has significantly lower prevalence of overweight children as compared to other regions, but the total burden is larger because of population size, estimated at 18 million children in 2010 (De Onis, Blossner, and Borghi, 2010). Figure 5 shows trends over time in stunted and overweight children for the two UN South Asia sub-regions. It is evident that while stunting will continue to be a larger issue, the prevalence is dropping quickly while overweight prevalence is growing.
FIGURE 5: Trends In Child Overweight And Stunting, Children Under Five, 1990-2020
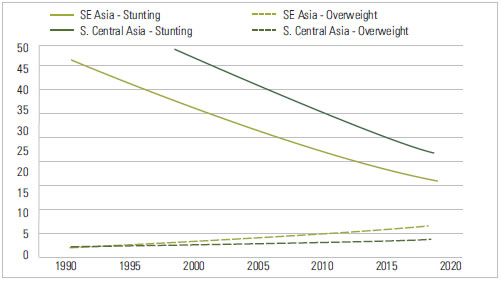
Source: De Onis, Blossner, Borghi 2010, De Onis, Blossner, Borghi 2011. UN Regions (not WHO Regions) were used in these papers, and therefore also in Figure 5. Country lists for these sub-regions can be found at: http://unstats.un.org/unsd/methods/m49/m49regin.htm#asia.
Figure 6 shows national averages for overweight in children for the L/LMIC in SSE Asia. While many countries have quite low rates of child overweight, a selection of countries (Bhutan, Indonesia) has rates that are close to or equal the rates seen in the United States.
FIGURE 6: Prevalence of Overweight, Children under Five, Latest Year
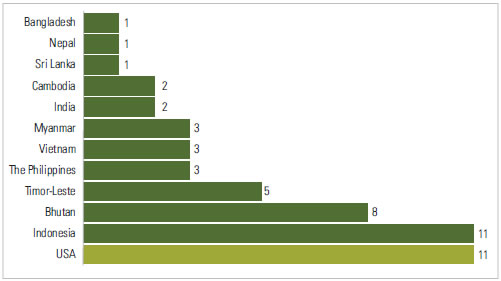
Source: Countries without a recent DHS use WHO child overweight figures, for children under five. DHS figures are also for children under five. The U.S. figure is from CDC, for children two – five years old. No data available for any source for Lao People’s Democratic Republic.
Currently, SSE Asia appears to be facing a moderate burden of diabetes, and a low–to–moderate generalized risk of N-RNCDs, though there is reason to believe that risk will increase in the future. SSE Asia currently has the highest rates of low birth weight and burden of stunting of any region (see country profiles as well as De Onis, Blossner and Borghi 2011, Kothari & Abderrahim 2010), two conditions that are associated with increased risk of developing N-RNCDs later in life (Barker, 1992 and Gluckman, 2010). As calorie availability becomes greater over time, these conditions could create a rapid growth in N-RNCDs beyond the age of five years. Figure 7 shows the trends over the last decade in calories per capita.
FIGURE 7: Trends in Average Calorie Availability, SSE Asia Region, 1999-2008
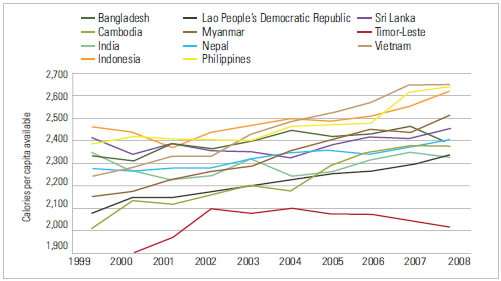
Source: FAOSTAT database, accessed September 2012. Uses Crops Primary Equivalent method.
On average, SSE Asia countries gained 180 calories per capita over this time period. A few countries gained little or no calories at the national level, such as Bangladesh (dark green), India (light green), and Sri Lanka (purple). Trends for women’s BMI are shown in Figure 8 for the same time period. One would expect that the trends for women’s BMI would be somewhat similar over the same time period, since both are driven by country wealth and are related to one another. However there are several exceptions.
FIGURE 8: Trends in Mean BMI, Women 20 and Older, 1999-2008
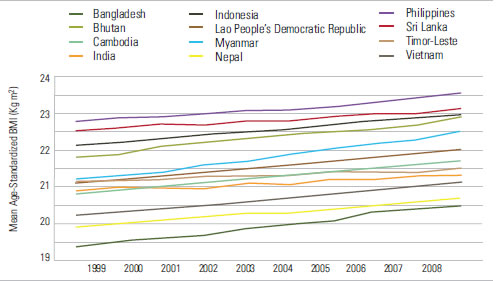
Source: Global Burden of Metabolic Risk Factor of Chronic Diseases Collaborating Group, accessed August 2012.
Bangladesh stands out as having a greater than average gain in mean BMI (1.1 kg/m2) while they only gained 55 calories per capita. Vietnam gained 404 calories, while only increasing mean BMI by 0.9 kg/m2. Many other factors can affect these measures, making them imperfect for tracking N-RNCD risk. Better, more explicitly collected methods will need to be developed to monitor growth in risk factors.
Conclusion
Based on current evidence, it appears that the SSE Asia region has low–to–moderate generalized risk for N-RNCD growth as compared to other world regions. However, the prevalence of overweight adult females is growing quickly in several countries, and the combination of high rates of low birth weight, stunting, and increased calorie availability may lead to a significant increase in N-RNCDs in this region over the next decade. Countries should begin to address this emerging issue in their health and nutrition strategic planning and budgeting process. They should also establish standards of care for common N-RNCD conditions, as was recommended by WHO at the 2008 World Health Assembly (WHO, 2010). More information on current child nutrition and potential future N-RNCD risk at the sub-national level can be found for several of these countries in individual country research briefs.
Definitions
Child Overweight: Weight for height Z score greater than +2 SD
Child Stunting: Height for age Z score less than -2 SD
Country Wealth: GNI per capita, Atlas method, US dollars.
Hypertension: Raised blood pressure (SBP>140 OR DBP>90 OR on meds)
Maternal Overweight: Body mass index greater than or equal to 25 kg/m2
Raised Glucose: Raised fasting blood glucose (> 7.0 mmol/L or on meds)
Raised Cholesterol: Raised total cholesterol (> 5.0 mmol/L)
Footnotes
1 For the purposes of these profiles, we define regions according to WHO. For detailed charts and figures, we limit the data presented to only those countries in each region categorized as low income or low-middle income by the World Bank in 2011. For South and Southeast Asia specifically, we also include four countries from the WHO Western Pacific region that are of high interest for nutrition and are often classified as part of the Southeast Asia region by USAID and UNICEF: Cambodia, Lao People’s Democratic Republic, the Philippines, and Vietnam.
2 For DEFINITIONS of all terms used in this profile, please see below.
References
Alwan, A., WHO, 2011. Global status report on noncommunicable diseases 2010. Geneva, Switzerland: WHO.
Barker DJB, ed. 1992. Fetal and infant origins of adult disease. London: BMJ Publishing Group.
CDC. 2011. CDC Health Data Interactive, for NHANES Data Round 2007-2010. Accessed 9/16/12.
De Onis, M., Blössner, M., Borghi, E., 2010. Global prevalence and trends of overweight and obesity among preschool children. Am. J. Clin. Nutr 92, 1257–1264.
De Onis, M., Blössner, M., Borghi, E., 2011. Prevalence and trends of stunting among pre-school children, 1990-2020. Public Health Nutr 1–7.
Gluckman PD, Hanson MA, Buklijas T., 2010. A conceptual framework for the developmental origins of health and disease. J DOHaD 1, 6–18.
Kothari, Monica and Noureddine Abderrahim. 2010. Nutrition Update 2010. Calverton, Maryland, USA: ICF Macro.
WHO, 2004. Appropriate body-mass index for Asian populations and its implications for policy and intervention strategies, 2004. Lancet 363, 157–163.
WHO, 2010. Package of Essential Noncommunicable (PEN) Disease Interventions for Primary Health Care in Low-resource Settings. Geneva, Switzerland: WHO.