Introduction | Methodology | Results | Challenges and Lessons Learned | Conclusions and Recommendations | References | Appendices

Highlights
The Strengthening Partnerships, Results, and Innovations in Nutrition Globally (SPRING) project is a five-year cooperative agreement funded by the U.S. Agency for International Development (USAID) that began in October 2011. SPRING's overarching vision is to prevent stunting and to work with women and children on reducing anemia through social and behavior change communication (SBCC) for nutrition; maternal, infant, and young child nutrition programming with a focus on the first 1,000 days; and implementation research that addresses the challenges of delivering effective nutrition programming at scale. As part of its start-up phase, the SPRING/Uganda team conducted a baseline survey on nutrition, HIV, and child health-related indicators using the Lot Quality Assurance Sampling (LQAS) methodology to guide program implementation. Of the six districts where this survey was conducted, three (Kisoro, Ntungamo, and Namutumba) are SPRING intervention districts, and the other three (Buhweju, Rubirizi, and Mayuge) were used as control districts.
SPRING/Uganda's primary goals are reducing stunting levels in children aged 0–23 months and anemia in children 0–23 months and women of childbearing age. The project has a secondary goal of reducing the proportion of children and adults with severe acute malnutrition in Southwest (SW) Uganda. Given these goals, the implementation team highlighted a number of key indicators to be used for tracking program effectiveness. These key indicators include nutrition practices, access to quality nutritious foods, and utilization of health and community services that improve nutrition. This study collected data on key indicators at the household level, including the indicators listed in Table 1. In addition, SPRING/Uganda has a focus on SBCC as a tool for improving nutrition outcomes. To enhance SBCC programming, the study also collected data on exposure to nutrition messaging. These findings are included in section 3.6 and Appendix 2 of this report.
Details on the survey methodology and specifics on most of the findings can be found in the main body of this report. While results for many of the indicators are fairly well-balanced between intervention and control districts, there are a few key indicators for which estimates vary significantly between districts, including breastfeeding practices, complementary feeding practices, and indicators around health service utilization and consumption of fortified foods. These findings, as well as differences between regions for a number of indicators, highlight the fact that nutrition programming must be context-specific to address the varying levels of current practices. SPRING/Uganda must closely track implementation in their intervention districts, as well as changes in programming in the control districts, in order to be able to compare changes over time between the two sets of districts.
Table A. Key Survey Findings
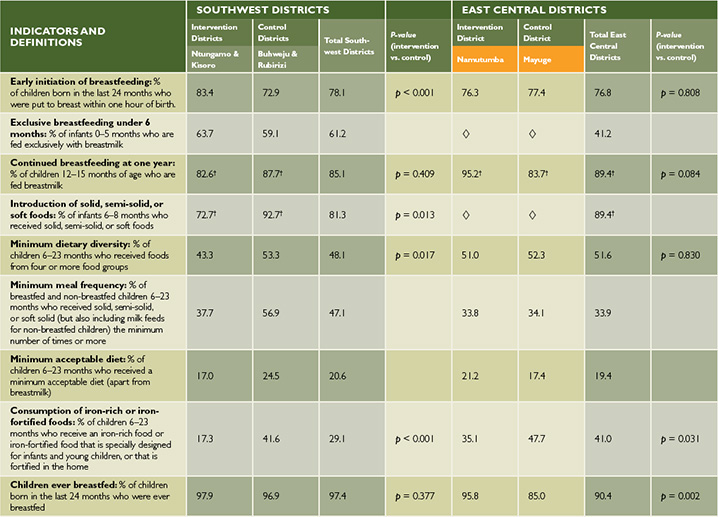
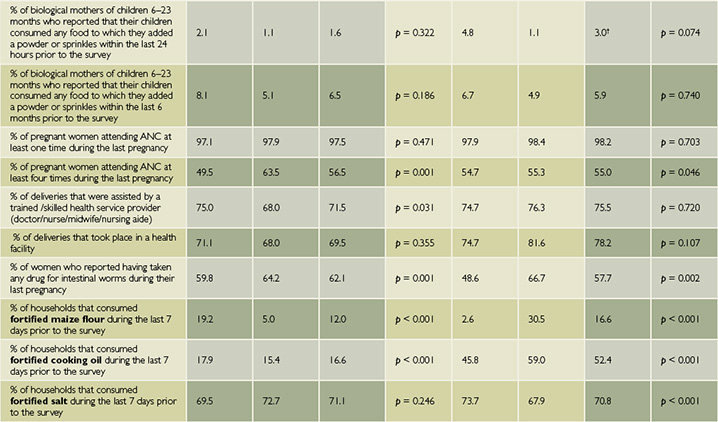
Additional Indicators
◊: Sample size is too low for results to be disaggregated.
†Sample size is low, but results can be used as a proxy.
Introduction
Background
The Strengthening Partnerships, Results, and Innovations in Nutrition Globally (SPRING) project is a five-year cooperative agreement funded by the U.S. Agency for International Development (USAID) that began in October 2011. SPRING's overarching vision is to prevent stunting and work with women and children on reducing anemia through: social and behavior change communication (SBCC) for nutrition; maternal, infant, and young child nutrition programming with a focus on the first 1,000 days; and implementation research that addresses the challenges of delivering effective nutrition programming at scale.
SPRING/Uganda's USAID-funded work began in Kisoro and Ntungamo in 2012 to integrate malnutrition treatment and prevention services in selected health facilities, and to support the development and implementation of a comprehensive package of high-impact nutrition services through capacity and systems strengthening at the facility, community, and district levels. The interventions have been designed to reduce levels of stunting, anemia, and severe acute malnutrition.
Figure 1. SPRING/Uganda Building Blocks for Program Impact Pathway
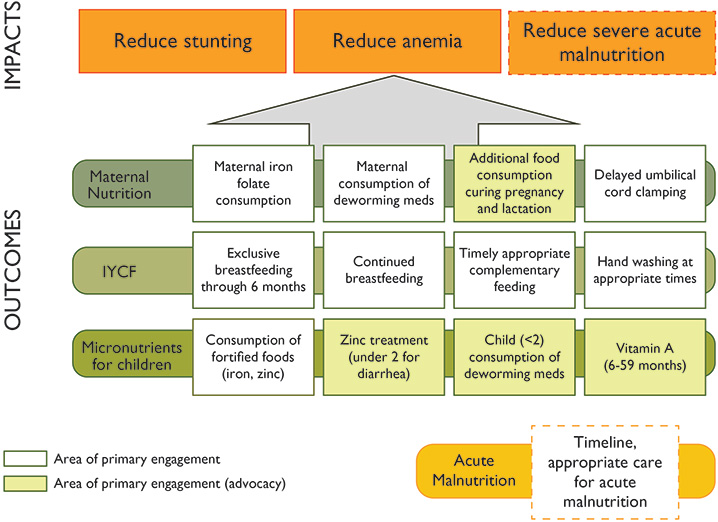
SPRING/Uganda's primary goals are reducing stunting levels in children aged 0–23 months and anemia in children 0–23 months and women of child-bearing age. The project has a secondary goal of reducing the proportion of children and adults with severe acute malnutrition in Southwest (SW) Uganda. The interventions include increased demand for nutrition prevention and treatment services, increased availability of nutrition services at the facility and community level, increased access and coverage of targeted nutrition interventions for vulnerable groups, improved quality of nutrition services at the facility and community level, and advocacy at the national level to improve the social and policy environment for nutrition programs. The project impact pathway is shown in Figure 1.
In late 2012, SPRING entered into agreement with the Partnership for HIV-Free Survival (PHFS) to implement their intervention in SPRING's two existing districts (Ntungamo and Kisoro) in SW Uganda, as well as Namutumba in the East Central (EC) region. For PHFS, the project will contribute to the elimination of mother-to-child-transmission (MTCT) through targeted nutrition assessment, counseling, and support (NACS) interventions during the first 1,000 days (prior to conception, during pregnancy, at delivery, and postpartum period up to 24 months of a child's life). The PHFS intervention layers on top of SPRING's interventions, with the goal of contributing to the reduction of MTCT of human immunodeficiency virus (HIV) from 15 percent to 3 percent by 2015. This will be done through integrating NACS into ongoing antenatal and postnatal interventions. Activities include capacity building of service providers in NACS and quality improvement, creating demand for services through community mobilization, strengthening the health service delivery system, and strengthening monitoring and evaluation for nutrition services within HIV/AIDS services.
Prior to the addition of PHFS interventions to SPRING's mandate, SPRING had designed an analysis plan and survey protocol to measure the effects of SPRING's intervention, to be fielded in early 2013. Given this new partnership, and the knowledge that many other partners are working on similar goals in SPRING districts, the project explored alternative data collection and analysis options to reduce redundancy of surveys in these districts and to strengthen the project's ability to collectively show changes in these districts, disregarding attribution to one single project.
While many of the SPRING's key indicators must be tracked through facility-level data, especially those for the PHFS programming, this survey was designed to get information about household-level actions related to nutrition. These indicators can be used both to shape programming, through a better understanding of current nutrition practices and access to information, as well as to track the effect of implementation, since many of these same indicators are outcomes that SPRING aims to affect. These key household indicators include utilization of health services during pregnancy, nutrition practices during the 1,000 days, and household knowledge of and access to nutrition information.
Over the last four years, the Lot Quality Assurance Sampling (LQAS) methodology used in this survey has been successfully used by the USAID/Strengthening Tuberculosis and HIV/AIDS Responses in East Central Uganda (STAR-EC) program as well as other organizations in Uganda and elsewhere to establish the progress of different national-, district-, and program-level indicators at the community level. Based on this and several other advantages this methodology possesses when compared to other survey methodologies, SPRING undertook this activity using the same methodology.
Survey Objectives
The survey objectives were to collect and analyze nutrition and HIV survey data in six districts of SW and EC Uganda, using LQAS techniques at the subcounty level, with lot samples collected so that they can be rolled up to aggregated random samples at the district level.

This survey activity was conducted to help SPRING collect baseline information to use during program planning, annual program progress follow-up, and during final evaluation of the program, with a focus on indicators related to knowledge of infant and young child feeding (IYCF) practices, exposure to SBCC messaging around these topics, as well as additional indicators related to HIV/AIDS awareness and practices. All of these are indicators relevant to SPRING's programming and interventions in its three intervention districts. Data was also collected in three control districts of Mayuge in the EC region as well as Rubirizi and Buhweju districts in SW Uganda.
Literature Review of Nutrition and IYCF Practices
The 2002 Global Strategy for Infant and Young Child Feeding was developed by the World Health Organization (WHO) and UNICEF jointly, to revitalize world attention to the impact that feeding practices have on the nutritional status, growth, development, and health, and thus the very survival, of infants and young children. Malnutrition has been responsible, directly or indirectly, for over 50 percent of the 10.6 million deaths annually among children under five. Well over two-thirds of these deaths, which are often associated with inappropriate feeding practices, occur during the first year of life (WHO 2013).
Nutrition Status in Uganda
According to the Food and Agricultural Organization (FAO), plantain, starchy roots (cassava, sweet potatoes), and cereals (maize, millet, sorghum) make up most of the Ugandan diet, which is complemented by smaller amounts of pulses, nuts, and green leafy vegetables (FAO 2013). Rice is increasing in popularity in urban areas, but the Ugandan diet is generally lacking in micronutrient-rich foods, and the share of lipids and protein are very low. According to the FAO, food insecurity in the country is mainly due to poverty, adverse climate, low agricultural productivity, and civil insecurity. These factors are combined in Karamoja, a district with high rates of food insecurity. Undernourishment has decreased in the past 10 years but still affects 15 percent of the population.
Early initiation of breastfeeding and exclusive breastfeeding through six months of age are practices which are slowly increasing, but they are still not common throughout all parts of Uganda, and complementary feeding is not very diverse. According to the FAO, "these inappropriate practices, along with high morbidity, poverty and food insecurity, are major determinants of malnutrition among young children" (2013). The country as a whole has high levels of malnutrition; 33 percent of children under five are stunted, according to the 2011 Uganda Demographic Household Survey (UDHS), with 42 percent in the SW. Twelve percent of adult women suffer from undernutrition, and there are particularly high levels in the east and northern parts of the country. Uganda is currently undergoing a nutrition transition, mainly in urban areas, where over a third of women are overweight, with rates as high as 40 percent in Kampala District. According to the FAO nutrition profile, vitamin A supplementation is limited among children and women. Anemia affects half of all children under five and nearly a quarter of women of childbearing age (UBOS & Macro International Inc. 2011,2008). The immediate causes include inadequate dietary intake and disease. Malnutrition is a complex issue with many interconnected determinants. Table 1 shows national levels for a number of indicators that affect nutrition status and programming effectiveness. In addition to national averages, the table shows the rates for each indicator in the Southwest, the location of SPRING districts Kisoro and Ntungamo, and East Central, the location of SPRING district Namutumba, regions. The Southwest region has higher performance than the East Central region on nearly all indicators included in Table 1. Notable exceptions to this pattern are use of modern contraceptive methods, adult HIV prevalence, and observed place for handwashing in the home.
Table 1. Prevalence of Nutrition Determinants at National and Regional Level in Uganda, 2011
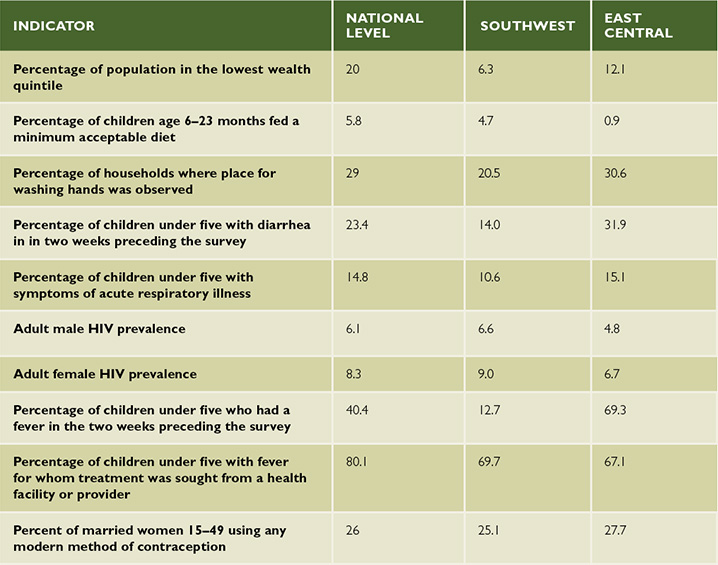
Household income obviously plays a large role in availability of food within the household, but it is important to have more information on what food is consumed by children and when. More details on IYCF practices, which explain part of dietary intake, are given in the next section, but Table 1 includes rates of children fed a minimum acceptable diet. Sanitation, represented in the table below by observation of a place for handwashing, also plays an important role in health status, affecting absorption of key nutrients. Rates of diarrhea can also suggest sanitation-related health issues that may affect nutrition status. Along with rates of various health issues, the table below allows an understanding of the context in which the SPRING nutrition intervention will be implemented. While the Southwest region generally outperforms East Central, both regions perform around or below the national average for many of the indicators, highlighting the need for a multi-pronged and multi-stakeholder effort to combat malnutrition.
Some of the IYCF Indicator Ugandan Results
According to the 2011 UDHS; overall, 63 percent of children under six months are exclusively breastfed, a slight improvement from 60 percent reported in 2006. Among subgroups, 82 percent of children less than two months of age are exclusively breastfed, but this percentage drops sharply at subsequent ages. In addition to breastmilk, 5 percent of infants under six months are given plain water only, 4 percent are given non-milk liquids and juice, and 9 percent receive other milk in addition to breastmilk. Eighteen percent of children under six months are given complementary foods in addition to breastmilk, indicating that very young children are mostly fed breastmilk. All children aged 6–9 months, in contrast, should receive complementary foods. However, 77 percent of children 6–9 months received complementary foods the day or night preceding the survey. Bottle feeding is becoming more common in Uganda; 15 percent of children under six months are using a bottle with a nipple, an increase from 11 percent in 2006. Bottle feeding peaks at 29–30 percent among children 4–11 months old (UBOS & Macro International Inc. 2011).
As part of this study, IYCF indicators were assessed and these included core and optional indicators listed in the WHO document Indicators for Assessing Infant and Young Child Feeding Practices (2010). The assessed core indicators included: early initiation of breastfeeding; exclusive breastfeeding under six months; continued breastfeeding at one year; introduction of solid, semisolid, or soft foods; minimum dietary diversity; minimum meal frequency; minimum acceptable diet and consumption of iron-rich or iron-fortified foods. Additionally, optional indicators assessed included: children ever breastfed; continued breastfeeding at two years; age-appropriate breastfeeding; predominant breastfeeding under six months; duration of breastfeeding; bottle feeding as well as milk feeding frequency for non-breastfed children.
Methodology
A Brief Background of the LQAS Methodology
The LQAS methodology was developed in the United States in the 1920s and is widely used in the manufacturing industry for quality control of goods produced on a production line. This methodology involves taking a small random sample of a manufactured batch (lot) and testing the sampled items for quality. If the number of defective items in the sample exceeds a predetermined criteria (decision rule), then the lot is rejected. The decision rule is based on the desired production standards and a statistically determined sample size. This methodology was borrowed by the public health sector, which uses a small sample of 19 respondents to provide an acceptable level of error for making management decisions. (Samples larger than 19 have practically the same statistical precision as 19—they do not result in better information, and they cost more [Lemeshow & Taber 1991].) Details of the history and statistics behind the LQAS method have been discussed in various literatures.
LQAS is a lower-cost, less time-consuming sampling method than traditional random sampling, and it can be adapted to the service sector by using supervision areas (SAs) instead of production lots to identify poorly performing areas that do not reach an established benchmark. In the aggregated LQAS methodology this survey used, the sampling can also provide an accurate measure of coverage or of service system quality at a more aggregate level (e.g., district or region). In this survey, existing lower-level administrative structures (subcounties) were used as SAs, and each district as a catchment area. When looked at from the district level, this approach is akin to stratified randomized sampling, and it produces a sample sufficient to assess district-level indicators. Information collected by using LQAS correctly can therefore yield a degree of precision in results that are at or above 92 percent confidence level (Valadez et al. 2003). Aggregation of districts across our study area, to the region or to intervention and control groups, also provides improved power. A minimum of five SAs per district were required to obtain an acceptable confidence level in the LQAS survey.1 SAs were derived with respect to population size and the geographical location/neighborliness of different subcounties. Weighting with respect to population size was used to derive SAs for districts with more than five subcounties. The higher the population of a given subcounty, the more likely it would be selected as a stand-alone SA. At the same time, if two or more subcounties within the same district were geographical neighbors and had a lower combined population than another subcounty in the same district, they would then form an SA. The overall district results for survey indicators will be used by program implementers in the future as a benchmark against which to assess SA performance as either below or above the desired performance. This methodology allows poorly performing areas to be identified as priorities for improved or enhanced interventions.
Questionnaire Preparation
HOUSEHOLD SURVEY GENERAL INFORMATION
1,716 respondents aged 15–54 years were interviewed, each from a different household.
572 villages were randomly sampled.
33.3% were males aged 15–54 years.
66.7% were females aged 15–49 years.*
A total of 855 respondents from intervention districts, and 861 respondents from control districts, were interviewed.
*All females interviewed were biological mothers of children 0–23 months old.
The questionnaire for this survey included modules on IYCF practices (WHO 2011); exposure to nutrition behavior change messages; maternal and child health; malaria management; immunization; HIV and AIDS knowledge, practices, perceptions, care, and support; and water and sanitation. Answers to questions about fortification of foods were verified by interviewers when food packaging was available. All modules used during this survey, except those on IYCF practices and nutrition messaging, were adopted from the STAR-EC annual LQAS surveys, which contain standard questions based on the new generation indicators developed by USAID and the U.S. President's Emergency Plan for AIDS Relief (PEPFAR), as well as on WHO, Uganda Ministry of Health (MOH), and Uganda AIDS Commission (UAC) indicators. Special attention was given to making sure that the indicators were useful for comparison with routinely collected service data. Survey questions were structured according to the standard questions used nationally and internationally to measure chosen indicators. Questionnaires were pretested in the field and revised accordingly.
A total of three survey questionnaires were developed, for the following three target groups: (1) biological mothers with children less than 11 months of age;2 (2) biological mothers with children 12–23 months of age;3 and (3) men aged 15–54 years.4
As presented in footnotes 2-4, most modules/questions were common across different target groups to ensure comparability and increase the sample size available for certain indicators. In addition, each individual questionnaire contained questions about socio-demographic and household characteristics (including location). By arranging questionnaires so that all respondents from the three target groups were asked the same questions, the sample size derived from all shared modules/questions was increased to 285 per district instead of 95, thus increasing the degree of precision in measuring such indicators at the aggregate level. Overall, the sample size for all three target groups in all six districts examined in this survey was 1,716 individuals.
Extensive pretesting of survey questions took place at the village level prior to the training of research assistants. Edits and various adjustments were made to improve data collection tools before the final questionnaires were printed. Revisions were also made after training of the research assistants, who provided suggestions and comments.
Training/Retraining
Training exercises were conducted for two different groups of research assistants. The first group was trained May 10–12, 2013, and included data collectors for Mayuge and Namutumba districts (in the EC region), while the second group trained May 14–17, 2013, and included data collectors for Buhweju, Kisoro, Ntungamo, and Rubirizi districts (in the SW region). In the EC region, data collectors were from the District Departments of Health and Community Development, and the majority had taken part in the previous STAR-EC LQAS annual activities, including the 2013 survey. In the SW region, research assistants with past survey experience were used. There were seven research assistants for each EC region district and eight for each SW region district.
The training covered the following topics: introduction to surveys and LQAS methodology, field preparation, sampling and selection of households, selection of respondents, pretesting, interviewing techniques, and logistics of data collection. The training was participatory, with practical sessions where the interviewers demonstrated knowledge of household selection within a miniature mock village. During the session on interviewing techniques, tips were provided to on how to contact a household in a village, explain the purpose of the study, gain cooperation, enumerate household members, select the respondent, ask questions in the required manner, put the respondent at ease, and accurately record the respondent's answers and any other required information. Role-play and mock interview training techniques were employed where applicable.
During the training, a day was dedicated to training interviewers on the questionnaires that were eventually used to collect data. A total of three questionnaire categories were reviewed (see section 2.2. During both training workshops, questions were translated into three local languages: Lusoga, Runyankore, and Rufumbira (covering the various languages spoken in the different districts involved in this study). As previously mentioned, a pretest of these questionnaires was conducted and its results were reviewed overnight by survey supervisors. The following day the results were discussed together with the field interviewer teams. Lastly, baseline and end-oftraining evaluation exercises were conducted as a means of establishing training participants' knowledge and recall levels.
Village and Household Sampling
As described in section 2.1, SA boundaries were formulated with respect to population size and geographical location of different subcounties within each district. Sampling was executed with each district considered as an independent catchment area and divided into four or five SAs. A two-stage sampling plan first randomly selected 19 villages (for districts with five SAs) or 24 villages (for districts with four SAs) within each SA by proportionate to size sampling. Sampling proportionate to size is a technique for surveys or mini-surveys in which the probability of selecting a sampling unit (e.g., village, camp) is proportional to the size of its population. It is most useful when the sampling units vary considerably in size because it ensures that units in larger sites have the same probability of getting into the sample as those in smaller sites, and vice versa.
The second stage of the sampling plan was to randomly select a household within each village. This step involved using the village local council household listings or register, which is periodically updated when in- or out-migration and movement within the village takes place. This is the most up-to-date household list, and in cases where one was not available, the interviewer compiled a list together with the village leader(s) based on a village map. Interview locations for the household survey were therefore selected using the updated household listings obtained from local authorities. More information on sample size can be found in section 2.2. Each of the six survey districts were divided into SAs as listed in Table 2.
Table 2. District Supervision Areas

Quality Assurance and Control
Quality assurance was an integral component of the entire survey process, which included appropriate preparation and orientation of research assistants to ensure sufficient training and familiarity with the survey processes and the different questionnaires; provision of adequate support and supervision by a team of supervisors5 at every stage of the survey with an emphasis on quality data collection; and regular and prompt feedback and reporting to each responsible survey line manager or consultant in each district by the data collectors.
At each survey stage, instant field problem solving as well as constant field editing was exercised by the participants themselves in each district. Fully edited questionnaires were given to each district supervisor. Cleaning of collected data took place at both the data entry and data analysis levels.

Ethical Considerations
Informed Consent
In this survey, every respondent had the right to refuse the interview or refuse to answer specific survey questions. Interviewers respected this right and obtained verbal informed consent before conducting the interview. Cases of lack of consent were almost nonexistent and had a negligible effect on the data collected. Most of the intended and randomly selected respondents agreed to be interviewed the very first time they were approached by an interviewer.
Privacy
It is important that each survey interview be conducted in a manner that is comfortable for the respondent and allows the respondent to speak openly and honestly. Therefore, all interviews were conducted in a private area in respondents' homes. During the interviews, no adult man, woman, or older child other than the respondent was present or able to hear the interview. Babies and younger children were allowed to be present during the interview in some instances. If a respondent indicated that she or he was uncomfortable holding the interview at home, the interview was done at another location of the respondent's preference.
Data Sources and Analysis
Households were the lowest units from which respondents to this household-based LQAS survey were obtained. Data analysis focused on assessing coverage levels for the different program indicators, and comparisons between districts. To a large extent, proportions were computed to determine the status of each indicator, and statistical tests (z-test, chi-square, and Fisher's exact) were applied to assess whether the resultant differences between intervention and control districts were significant at the 5 percent level. Disaggregation by district, respondent's age and sex, and other key variables were done to understand the possible factors behind the variations. Data were entered using the EpiData software, and Stata (Version 12) statistical software was used to compute proportions and significance levels. Lastly, all data were analyzed with respect to nationally and internationally recommended indicator definitions and measurement guidelines. Unless otherwise noted, all analysis in this report used indicator measurements and definitions from WHO's 2010 guidance document Indicators for Assessing Infant and Young Child Feeding Practices.
Results
Social Demographic Characteristics of Respondents
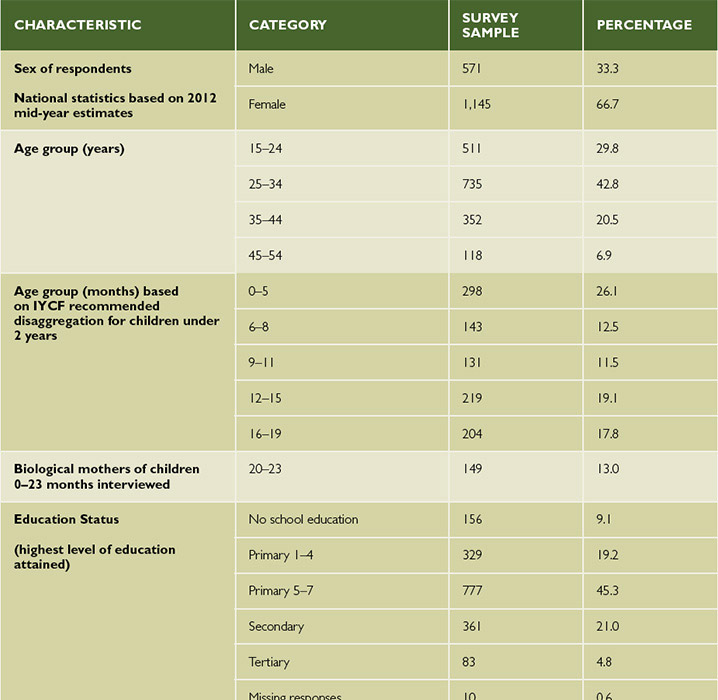
Overall, six districts (four from SW Uganda and two from EC Uganda) took part in this survey. More details on the list of districts and their respective supervision areas/subcounties involved in this survey can be found in Table 2. In addition, Table 3 shows the type of respondents interviewed for this survey and their different social demographic characteristics.
Table 3. Demographic Characteristics of Survey Population
Core IYCF Indicators
Early Initiation of Breastfeeding
Early initiation of breastfeeding refers to feeding of newly born children within one hour of birth with breastmilk. This practice helps babies to receive colostrum from their mother. Breastfeeding has many health benefits for both the mother and infant. To reduce infant mortality and ill health, WHO recommends that mothers breastfeed their infants within one hour of birth, continue breastfeeding exclusively for the first six months, and start complementing breastmilk with other foods from six months to at least 24 months. In many parts of the world, the rates of early initiation of breastfeeding are extremely low. Therefore, as part of this study biological mothers of children less than 24 months were asked about the time when they first breastfed their children after birth.
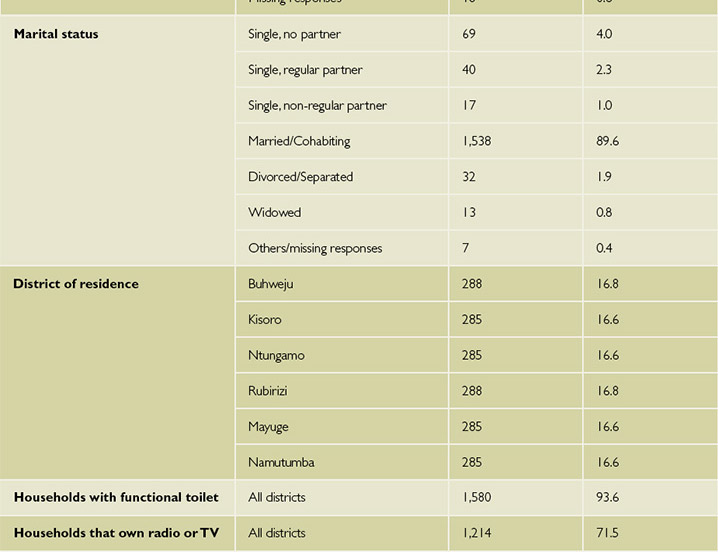
Overall, 77.7 percent (n = 1,144) of mothers in all intervention and control districts reported having their newly born children breastfeeding within one hour of birth. Further comparisons show significant differences (p = 0.007) among intervention and control districts at 81.1 percent (n = 570) and 74.4 percent (n = 574) respectively. Within the SW region, there were further significant differences in coverage (p < 0.001) between intervention (83.4 percent) and control districts (72.9 percent) while there were no significant differences (p = 0.808) in the EC region when Namutumba (an intervention district) was compared to Mayuge (a control district). Specific details can be found in Figure 2. Among the different biological mothers' groups in all the six assessed districts, 76.4 percent (n = 572) of those with children aged 0–11 months compared to 79.0% (n = 572) with children 12–23 months old (p = 0.287) reported having their newly born children breastfeeding within one hour of birth.
Figure 2. Proportion of Biological Mothers of Children Less than 24 Months who Reported Breastfeeding Their Child Within One Hour of Birth
Survey results further show that there were significant differences (p = 0.033) between women delivering/not delivering in health facilities and breastfeeding within one hour of birth. Overall, in all the six survey districts, 79.4 percent (n = 828) of the women who reported having given birth to their children from a health facility had at the same time breastfed them within one hour of birth while 73.4 percent (n = 316) was the finding among those who had not given birth from a health facility.
Exclusive Breastfeeding Under Six Months
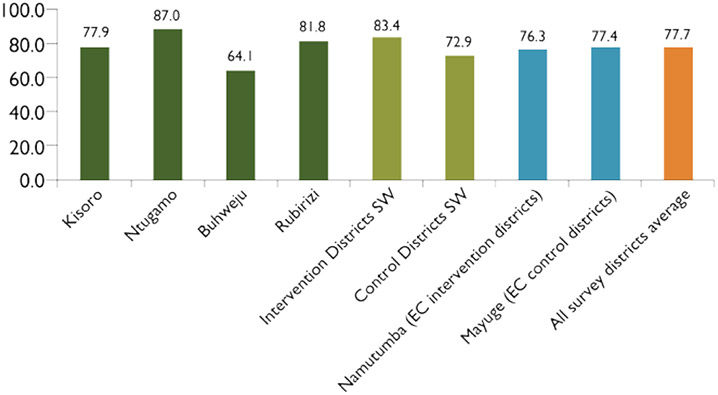
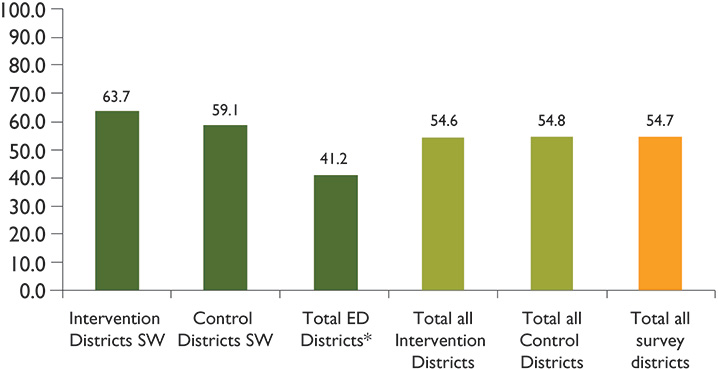
For the first six months of life, an infant should receive only breastmilk without any other liquid or solid foods. Even water is not acceptable, however, drops or syrups consisting of vitamins, mineral supplements, or medicines are allowed. The survey investigated this practice among biological mothers of children 0–5 months old and found that 54.7 percent (n = 298) had exclusively breastfed their children the previous day in all survey districts combined. Among the SPRING intervention districts, 54.6 percent (n = 130) were reported while 54.8 percent (n = 168) was the result from all control districts combined (p > 0.050). Further details can be found in Figure 3.
Figure 3. Proportion of Infants Aged Zero to Five Months Who Were Exclusively Breastfed the Previous Day
Continued Breastfeeding at One Year
From six months onward, all babies need complementary foods because breastmilk is no longer sufficient by itself to meet the increasing caloric and other nutritional needs of the child. Breastmilk is an important source of energy with high-quality nutrients; therefore it is expected to be continued by the mother until the child is two years old.6 According to available research, breastmilk can provide about 75 percent of the vitamin A that a child needs, provided the mother is not deficient in vitamin A herself. In addition, some studies have proved that breastfeeding beyond one year would not only give further protection and immune support to the baby but also reduce the chances of women acquiring breast cancer. As part of the investigations for this survey, biological mothers of children were asked about continued breastfeeding at one year.
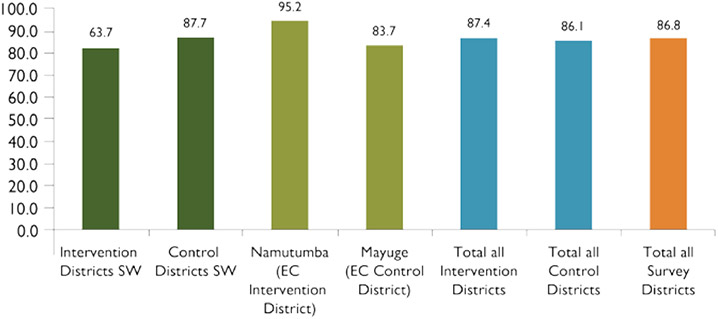
As shown in Figure 4, overall, 86.8 percent (n = 219) of children 12–15 months of age were reported to be breastfed milk the day prior to this survey. There were no major differences when comparing control and intervention districts (p = 0.781). Further analysis at a district-specific level could not be possible as the sample size would become much lower.
Figure 4. Proportion of Children 12–15 Months whose Mothers Reported Feeding Them with Breastmilk the Day Prior to the Survey
Introduction of Solid, Semi-Solid, or Soft Foods
As explained in section 3.2.3, at six months of age, a child is expected to start receiving solid (or semi-solid) food in addition to breastmilk or a breastmilk substitute. Overall, 83.9 percent (n = 143) of infants 6–8 months of age were reported having received solid, semi-solid, or soft foods a day prior to this survey within the SPRING program intervention districts. When compared to the non-program districts of Buhweju, Rubirizi, and Mayuge whose results were at 91.8 percent, the overall intervention districts coverage was less at 78.1 percent. More specific details can be found in Appendix 1.
Minimum Dietary Diversity
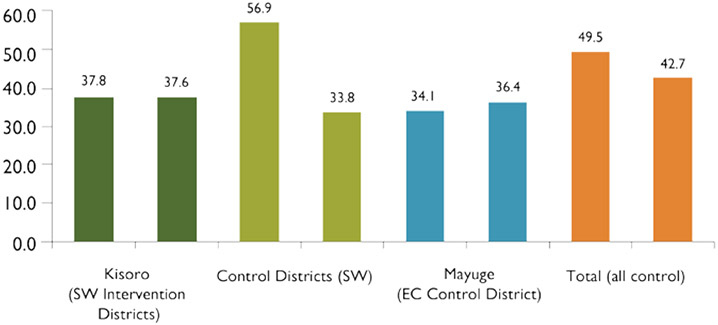
As part of investigations among children who receive the minimum dietary diversity, 49.3 percent (n = 846) children aged 6–23 months of age were reported to have received foods from four or more food groups. There were significant differences (p = 0.041) between intervention (45.9 percent, n = 440) and control (53.0 percent, n = 406) districts. Among intervention districts, both SW districts had lower results (43.2 percent and 43.3 percent for Kisoro and Ntungamo respectively) when compared to Namutumba District (51.0 percent) in the EC region. At the same time, fewer children aged 6–11 months received foods from four or more food groups than did older children. More details can be found in Table 4.
Most biological mothers in the intervention districts (29.6 percent, n = 130 and 25.0 percent, n = 110) reported that their children aged 6–23 months had received WHO-recommended food groups 3 and 4 (respectively) the day prior to the survey. The least consumed foods were in groups 7 (1.8 percent) and 1 (4.3 percent). Figure 5 illustrates the most common WHO-recommended food group types among both intervention and control districts. It is important to note that the findings in this graph do not match the results from the most recent Demographic Household Survey conducted in Uganda. Compared to the DHS results, this survey found much lower rates of grains, vitamin A-rich foods, and fruits and vegetables, as well as slightly higher rates of legume/nut and egg consumption. The cause of these differences requires further investigation.
Table 4. Proportion of Children 6–23 Months Whose Mothers Reported Providing Four or More Food Groups the Day Prior to the Survey
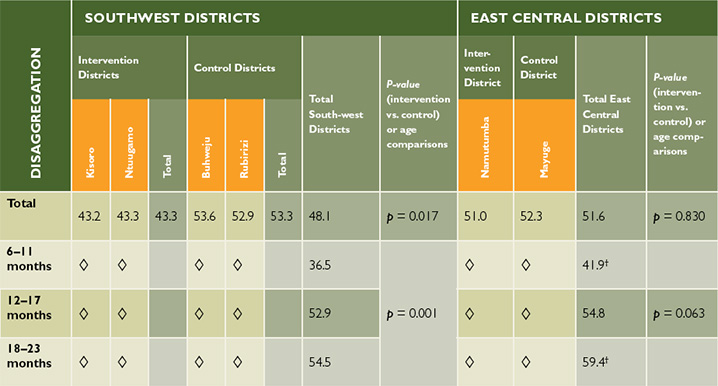
†Sample size is low, but results can be used as a proxy.
Figure 5. The Most Common WHO-Recommended Food Group Types Consumed by Children Aged 6–23 Months During the Day Prior to the Survey, by Intervention and Control Districts
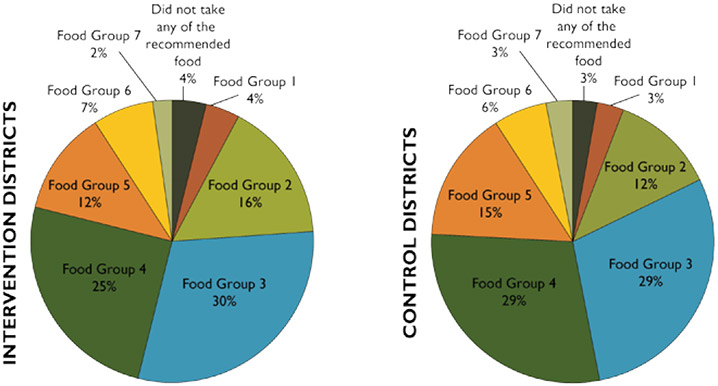
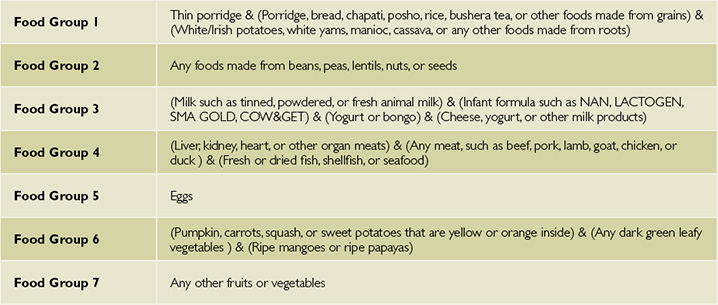
Table 5. WHO-Recommended Food Group Classification
Minimum Meal Frequency
According to WHO, minimum meal frequency is defined as the proportion of breastfed and non-breastfed children 6–23.9 months of age who receive solid, semisolid, or soft foods or milk feeds the minimum number of times or more. Minimum meal frequency includes:
- Two times for breastfed infants 6–8 months
- Three times for breastfed children 9–23 months
- Four times for non-breastfed children 6–23 months
Overall 42.7 percent (n = 846) of breastfed and non-breastfed children aged 6–23 months of age received solid, semisolid, or soft foods (but also including milk feeds for non-breastfed children) the minimum number of times or more. Figure 6 details findings by control/intervention district and age group.
Figure 6. Proportion of Children 6–23 Months Whose Mothers Reported Feeding Them Solid, Semi-Solid, or Soft Foods* the Day Prior to the Survey
Minimum Acceptable Diet
This composite indicator is calculated from the proportion of breastfed children aged 6–23 months who had at least the minimum dietary diversity and the minimum meal frequency during the previous day and the proportion of non-breastfed children aged 6–23 months who received at least two milk feedings and had at least the minimum dietary diversity not including milk feeds and the minimum meal frequency during the previous day. A minimum acceptable diet is essential to ensure appropriate growth and development of infants and young children. Without adequate diversity and meal frequency, infants and young children are vulnerable to malnutrition, especially stunting and micronutrient deficiencies, and to increased morbidity and mortality.
The proportion of children 6–23 months who received a minimum acceptable diet (apart from breastmilk) from Namutumba District in EC Uganda was 21.2 percent (n = 151) compared to 17.0 percent (n = 289) from the SW region intervention districts of Kisoro and Ntungamo. Additionally, when comparing districts within the SW region, results showed that more children had received a minimum acceptable diet in control districts (24.5 percent, n = 274) than in intervention districts (17.0 percent, n = 289). In the EC region, differences also existed between intervention (21.2 percent, n = 151) and control districts (17.4 percent, n = 132).
Consumption of Iron-Rich7 or Iron-Fortified8 Foods
Iron-rich foods include any food items containing relatively large amounts of iron. Such examples include liver, kidney, heart, lean meat, or other organ meats. Among the best plant sources include leafy green vegetables, whole grains, and legumes. Fortified foods are defined as foods that have certain nutrients added to improve their nutrient content, as reported by mothers during the interviews and verified by interviewers when possible. Children 6–23 months were assessed for such a diet.
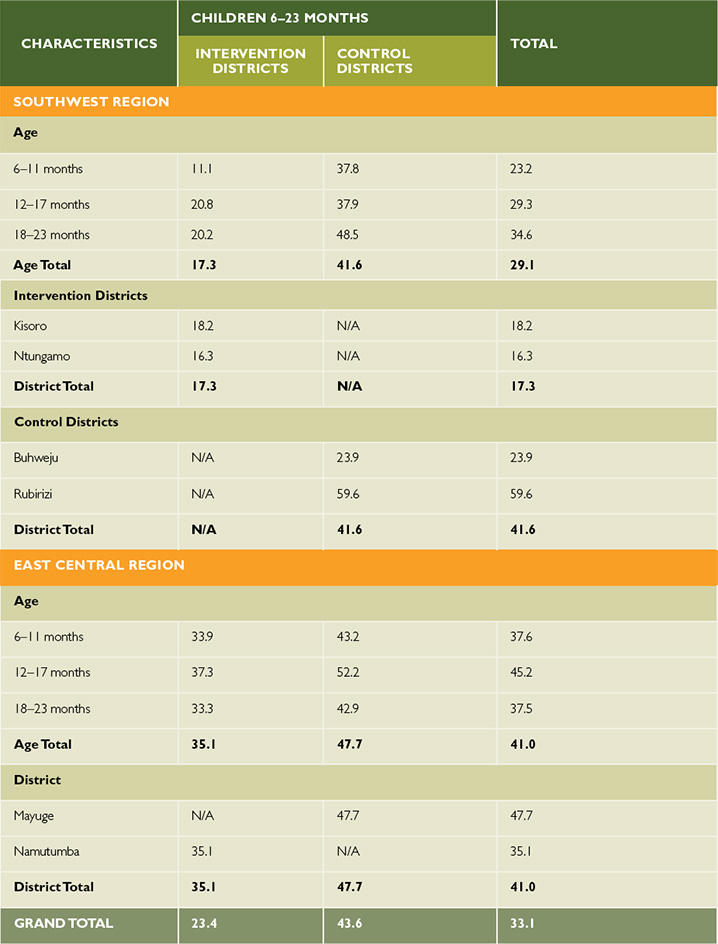
Overall, results from all study districts show that 33.1 percent (n = 846) of children 6–23 months of age were reported to have received an iron-rich or iron-fortified food that is specially designed for infants and young children. Table 6 illustrates disaggregation by control/intervention districts and age group.
Table 6. Proportion of Children 6–23 Months who Received an Iron-Rich or Iron-Fortified Food
Optional IYCF Indicators
Among the optional IYCF indicators assessed during this study include those on: children ever breastfeeding; continued breastfeeding at two years; age-appropriate breastfeeding; predominant breastfeeding under six months; bottle feeding and milk feeding frequency.
Children Ever Breastfed
In the SW and EC intervention districts, 96.9% and 95.8% respectively of children 0–23 months have ever been breastfed since they were born.
Overall, results from all the six districts show that 95.1 percent (n = 1,134) children aged 0–23 months had ever been breastfed since they were born. Among intervention districts, Kisoro had the highest result (98.4 percent, n = 190) while the lowest was reported from Namutumba District at 95.8 percent (n = 190). Comparisons between intervention (97.2 percent, n = 566) and control (93.0 percent, n = 568) districts show significant differences in coverage (p = 0.004) with the former having more coverage.
Among the SW region districts, there were no significant differences in coverage (p = 0.377) between control (97.9%) and intervention districts (96.9 percent) while in the EC region, there were significant differences (p = 0.002) between Namutumba (an intervention district at 95.8 percent) and Mayuge (a control district at 85.0 percent).
Continued Breastfeeding at Two Years
Mothers were asked if they were still breastfeeding their children aged 20–23 months.9 Overall, less than half (46.3 percent, n = 149) of these mothers were still breastfeeding their children. Control districts (48.5 percent) had slightly but not significant (p = 0.635) coverage as compared to intervention districts (44.6 percent). In the SW region, a higher proportion of mothers from control districts (49.1 percent) reported breastfeeding their children than mothers in intervention districts (43.8 percent, p = 0.567). Findings from the EC region were similar. Further subgroup analysis of this indicator is not be possible as the sample size from which to draw such comparisons becomes too low for significant comparisons to be made. Such results can only be used as a proxy and are found in Appendix 1 of this report.
Age-Appropriate Breastfeeding
In the Indicators for Assessing Infant and Young Child Feeding Practices Handbook, WHO defines "age-appropriate breastfeeding" as a summary measure of the proportion of children less than two years of age who are appropriately breastfed and who receive complementary foods when needed (2010). The sample universe for this indicator is children 0–23 months of age living with their mothers. This indicator captures information about exclusive breastfeeding for children 0–5 months; and about the dual practice of breastfeeding and complementary feeding for children 6–23 months.
Mothers in SW control districts reported slightly higher proportions of appropriate breastfeeding (72.4 percent, n = 384) than intervention districts compared to 70.3 percent (n = 380). While there were not many differences in coverage in the SW region, there were large differences in coverage (p < 0.001) in the EC region. A total of 86.8 percent (n = 190) mothers in Mayuge (control district) reported their children receiving appropriate breastfeeding, compared to 71.6 percent (n = 190) in Namutumba (intervention district).When comparing results across all SPRING intervention districts, findings show that Ntungamo District had the lowest result (66.8 percent, n = 190) while the highest was reported from Kisoro District at 73.7 percent (n = 190).
Predominant Breastfeeding Under Six Months
As pointed out by the WHO's guidelines (2010), although previous studies did not find any significant effect on mortality between exclusive and predominant breastfeeding, there are other reasons to recommend exclusive breastfeeding as the preferred option when compared to predominant feeding for children under six months of age. The same WHO report details that predominant breastfeeding has been associated with an increased risk of diarrhea. Avoidance of any liquids other than breastmilk is key to ensuring appropriate feeding of infants less than six months of age, unless there is a medical reason to do otherwise. Predominant breastfeeding does allows children under six months to consume oral rehydration salts, vitamin and/or mineral supplements, ritual fluids, water and water-based drinks, and fruit juice. Other liquids, including non-human milks and food-based fluids, are not allowed, and no semi-solid or solid foods are allowed.
A total of 65.9 percent and 63.6 percent of biological mothers with children under six months of age in the SW intervention and control districts (respectively) reported that their infants were predominantly breastfed. Though based on a low sample size of 97 respondents, findings showed that Namutumba (64.1 percent) an intervention district in the EC region had a higher proportion of children predominantly breastfed when compared to the control district of Mayuge (51.7 percent).
Bottle Feeding
Bottle feeding is the practice of feeding an infant or any young child from a bottle that contains a nipple or rubber at its tip and is normally used in substitution for and/or as a supplement to breastfeeding. This practice is steadily increasing in Uganda. Though not significant (p = 0.329), findings among the SW intervention districts show that the use of bottle feeding increases with age and is highest in children 12–23 months. Table 7 summarizes findings on bottle feeding as a practice in SW and EC Uganda.
Table 7. Proportion of Children 0–23 Months of Age Who Are Fed With a Bottle
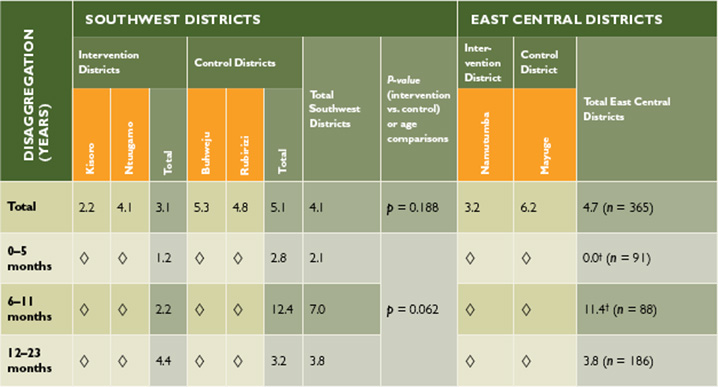
†Sample size is low, but results can be used as a proxy.
Milk Feeding Frequency for Non-Breastfed Children
When an assessment was conducted among non-breastfed children and whether they were feeding on milk and other milk products10 plus the frequency involved, findings showed that 20.5 percent (n = 176) of non-breastfed children 6–23 months of age received at least two milk feedings in the past 24 hours. The proportions of children receiving at least two milk feedings were slightly lower in control districts (17.6 percent, n = 91) than in intervention districts (23.5 percent, n = 85). However, comparisons within regions are not very reliable as the sample size from which to draw this analysis became lower. As a proxy result, it is interesting to note that 25.4 percent of non-breastfeeding children in SW intervention districts received two or more milk feedings, compared to 18.2 percent in control districts. In the EC region, findings were much lower for Namutumba (intervention district, 19.2) than Mayuge (control district, 16.7 percent) respectively.
Additional Nutrition Indicators
Consumption of Home-Fortified Foods
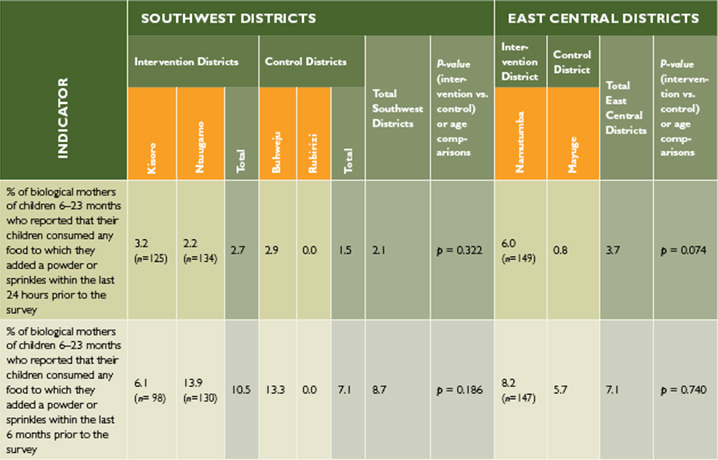
In order to assess the consumption of home-fortified foods by children aged 6–23 months, two questions were asked to respondents on the consumption of such foods within the last 24 hours and last six months prior to the survey. Overall, the consumption of such foods was witnessed to be very low even when measured against the last six months prior to the survey. Most district results were reported at less than 10 percent as illustrated in Table 8. Additionally, there were no significant differences between control and intervention districts from both regions.
Table 8. Consumption of Home-Fortified Food among Children Aged 6–23 Months
Consumption of Industrially-Fortified Foods at Household Level
In addition to what has been presented in the previous section, respondents were asked about the consumption of certain foods by the household in the seven days prior to the survey and whether such foods were industrially fortified. These included maize flour, cooking oil, sugar, and salt. Of all the foods included, most respondents within the SW intervention districts reported that they had consumed fortified salt (69.5 percent, n = 380) while at the same time this proportion was found to be highest in Namutumba (an intervention district in the EC region) at 73.7 percent (n = 190). Use of fortified cooking oil was found to be the lowest among SW region intervention districts (17.9 percent, n = 380) followed by fortified maize flour at 19.2 percent (n = 380). However, when assessing both intervention and control districts, Namutumba District in the EC region was found to have the lowest proportion for the use of any fortified food (fortified maize in particular) at 2.6 percent (n = 190). More details can be found in Appendix 1.
Goal-Oriented Antenatal Care (ANC) Indicators
High-quality ANC counseling, improved services, and outcomes play a big role in improving nutrition outcomes among mothers and their babies. As part of this survey, biological mothers of children 0–23 months were asked questions related to goal-oriented ANC. Indicators assessed include: ANC attendance, frequency of ANC visits, use of iron and intestinal drugs during pregnancy, as well as deliveries at health facilities.
Overall, any ANC attendance (one or more visits) was reported in high proportions across all districts assessed during the study. In the SW region, proportions were reported at 97.1 percent (n = 380) and 97.9 percent (n = 384) among intervention and control districts respectively (p = 0.471). Attendance at four or more ANC visits was much lower at 49.5 percent (n = 380) and 63.5 percent (n = 384) among intervention and control districts (p = 0.001). Attendance at 4 or more ANC visits was slightly higher in Namutumba (54.7 percent, n = 190) than in the SW intervention districts. There were no significant differences (p = 0.046) between control and intervention districts in the EC region. See Figures 7 and 8 for further ANC findings.
Figure 7. Results of Different Goal-Oriented ANC Indicators (Percentages)—SW Region Districts
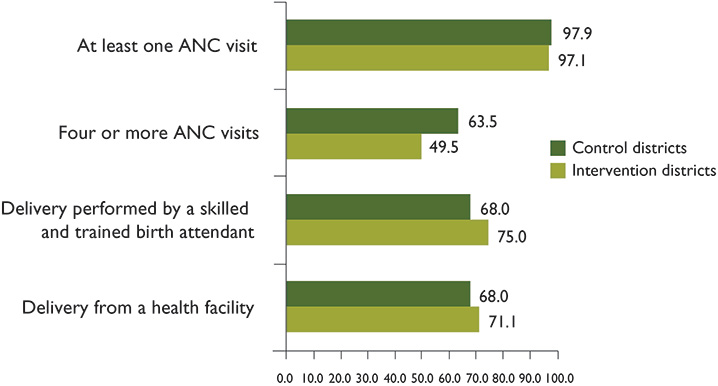
Figure 8. Results of Different Goal-Oriented ANC Indicators (Percentages)—EC Region Districts
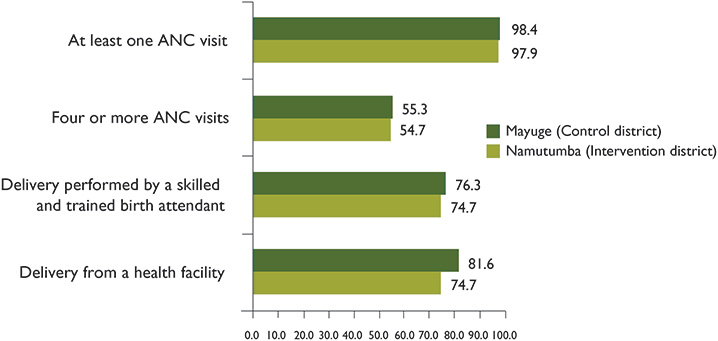
Figure 9. Proportion of Women who Reported Having Taken Iron Tablets, and the Number of Days They Took it During Their Last Pregnancy
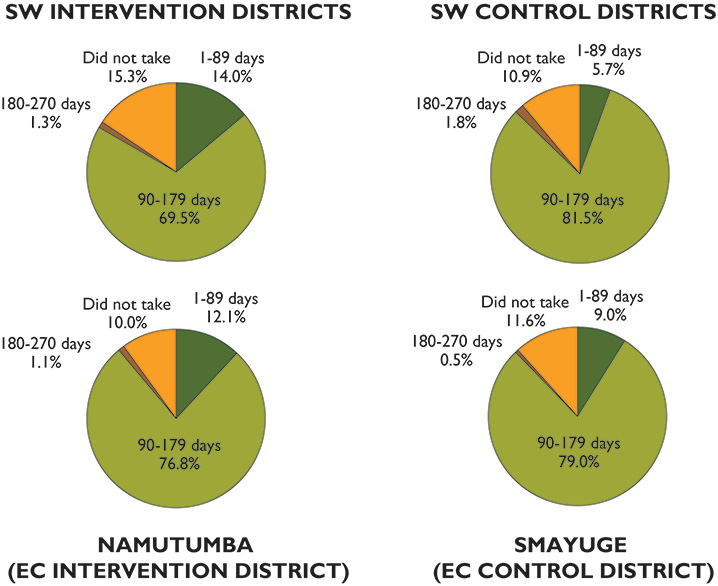
Nearly six in every 10 women (59.8 percent, n = 380) from the SW region intervention districts reported that they had taken a drug for intestinal worms during ANC, while only half of the women in Namutumba (48.6 percent, n = 190) reported taking the drugs. Women were also asked about consumption of iron tablets during pregnancy. Details can be found in Figure 9. Women were asked to report whether or not they had taken iron tablets during their pregnancy. Those women who indicated they had taken tablets were asked how many days they were taken for. Since most women are told to take one tablet per day, we can use these responses to approximate the number of tablets taken. This definition and measurement of the indicator is in line with similar surveys, including the UDHS.
Messaging for Social and Behavior Change Communication (SBCC)
SPRING uses SBCC as a strategic intervention in the promotion of knowledge, practices, and behavior to yield positive nutrition outcomes among mothers of children 0–23 months, as well as other household members that have influence over such children.
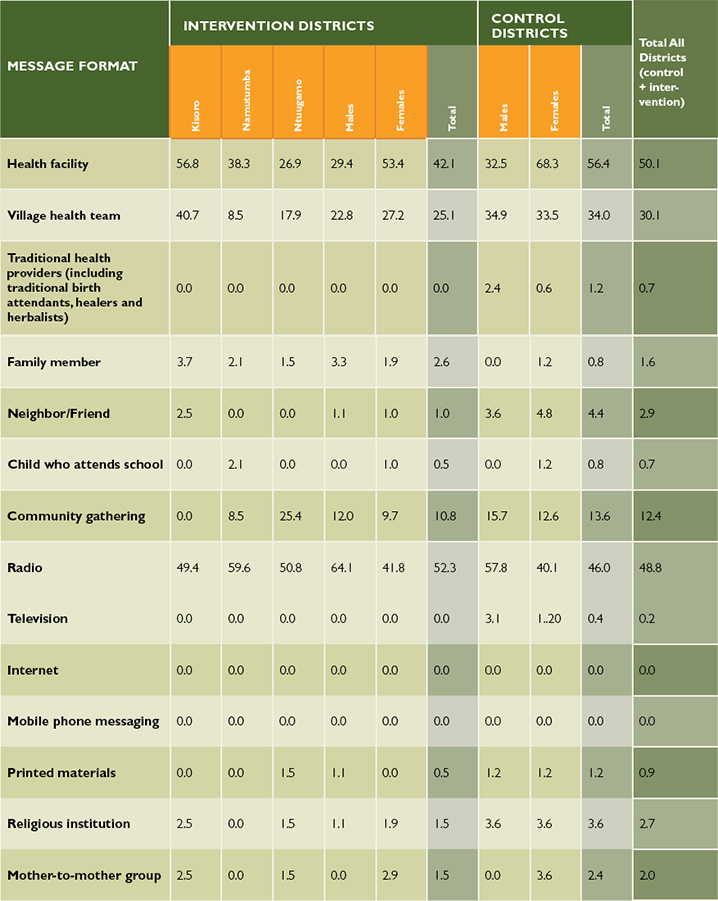
Overall, 26.3 percent (n = 563) and 16.7 percent (n = 282) of all respondents from the SW and EC intervention districts, respectively, reported that their households had received at least one message about proper nutrition for women or children in the last three months prior to the survey. Interestingly, when assessing findings in all intervention districts, more males (32.5 percent, n = 283) than females (18.3 percent, n = 562) reported that they had received at least one message about proper nutrition for women or children in the last three months prior to the survey (p < 0.001). Most respondents mentioned radio (52.3 percent) and health facility (42.1 percent) as the means through which they received these messages (see Table 9).
Table 9. Format by which Nutrition Messaging was Received among Individuals Who Received at Least One Message in the Three Months Prior to the Survey
When asked about messages on proper breastfeeding in the last three months, only 33.1 percent (n = 565) and 26.6 percent (n = 282) of respondents who had heard at least one message from the SW and EC intervention districts (respectively) had heard the message. Details of this and other thematic indicators can be found in Appendix 2. It is possible that the estimate presented in Table 9 and Appendix 2 could be affected by respondent's recall bias. To mitigate this possibility interviewer asked open-ended questions with minimal prompting to avoid suggesting responses to the interviewees.
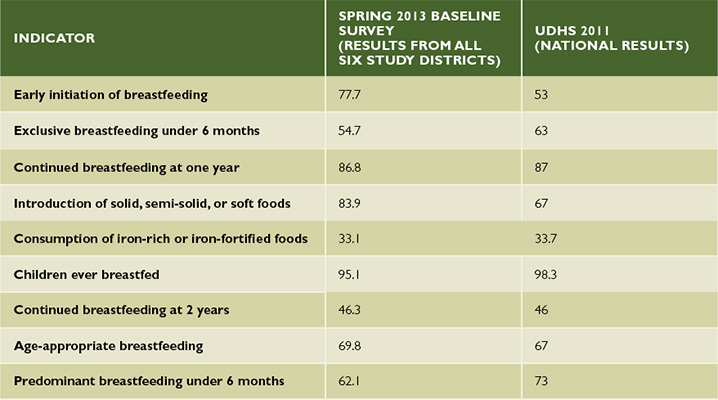
Comparison Between SPRING 2013 Baseline Results and the UDHS 2011
A comparison between selected findings from the 2011 Uganda Demographic Health Survey (UDHS) and this SPRING survey was drawn and findings largely show proportions within the same range. However, it should be noted that such comparisons are complicated due to the different years in which each study was conducted. Additionally, the geographical span (six districts) covered by the SPRING survey was only six districts in SW and EC Uganda, which is difficult to compare with all districts covered by the UDHS.
Table 10. Comparison Between the SPRING 2013 Baseline Study and UDHS 2011 Survey Findings
Challenges and Lessons Learned
Challenges
- Due to small sample size, IYCF indicators that require a denominator of 6–8 month-, 12–15 month-, and 20–23 month-old children could only be assessed and reported as a proxy especially at district or SA levels. The degree of precision is compromised with smaller sample sizes arising from such aforementioned age categories.
- There were some selected villages whose names had changed, however, data collectors were able to eventually find the correct villages with the help of the local guides. Therefore, the objectives of the survey were not compromised.
- Some survey questions required interviewers to observe items such as fortified foods. However, some respondents would not allow interviewers to make the necessary observations. Also, interviewers were not always able to observe a respondent's ANC card. In the absence of such cards, recall failure among some respondents could not be ruled out even though interviewers tried their best to probe for responses.
- Data collection in hard-to-reach places and districts was very challenging. These districts included Buhweju and Kisoro in SW Uganda, whose terrain is often too hilly for navigation. Further, the rural road network in some parts of these districts is in a poor state characterized with huge potholes, which slowed transportation. In some areas, data collectors had to walk for miles as there was no easy navigation of roads to selected villages. In Kisoro, one of the villages in the sample was on an island in one of the local lakes, which data collectors did not know before they began. The time and cost it took to reach this island was high. Most of the interviewers expressed concern about the length of time it took to get to some of the selected villages, as well as the time taken to find the first randomly selected household in the few number of days they had to accomplish allocated interviews.
- Unpredictable weather conditions made most research assistants lose time. This survey was conducted at a time when rains were still heavy. The rainy season in Uganda has changed over time and it is not easy to get accurate forecasts from geological departments in the country.
- This research uncovered statistical differences between the SPRING and control districts for a number of key indicators. SPRING carefully chose control districts with similar levels of partner involvement as the SPRING districts, but there are variations in nutrition programming between the districts. In addition, SPRING programming, while limited (see "Lessons Learned" below), had begun before data collection for this survey. SPRING plans to conduct annual data collection on these indicators and data analysis will focus on the changes over time in indicator levels, rather than the variations in the starting points of the intervention and control districts.
Lessons Learned
- The sample size used in this survey was sufficient for calculating most indicators at the 0–11 and 12–23 month age categories, however, it is not be enough for analysis and subgroup analysis of other interest groups (e.g., 0–5, 6–8, 12–15 and 20–23 month).
- Partnerships between USAID implementing partners on such undertakings are not only useful for promoting improved collaboration and coordination of activities but also for reducing activity costs that arise mainly from the advantages of the economies of scale. This was evident with the SPRING and STAR-EC partnership in the EC region. In addition, SPRING took Community Connector and SCORE baseline surveys into account while planning for this survey.
- During data collection, research assistants used local boda boda cyclists as village guides and as a transport means to various sampled villages. This served both as a quick way to reach out to sampled households and respondents as well as a cheaper means of transport than if each data collector hired a car. In districts with difficult terrain such as Kisoro, this method of transportation proved very useful.
- Building rapport with the local authorities is very important and builds confidence in the local community sharing their ideas and experiences freely.
- Due to the multiple competing priorities faced by district health authorities, the data collectors often found themselves performing district roles alongside this household survey exercise thus increasing the time taken to collect data. The hired research assistants used in the SW were more flexible and did not face the same time constraints.
- SPRING began hospital-based NACS interventions for nearly a year before the survey was conducted; however, community- and lower facility-level programming did not begin until May 2013. Given the small community reach of the hospital programming and limited nature of community programming when the baseline survey was conducted, this survey still serves as a fair assessment of the baseline situation in the intervention districts.
- These results are only quantitative and therefore cannot answer questions around why actions are or are not taking place. Further research will be needed to investigate the "why" of nutrition behaviors. These findings will be especially important in developing appropriate SBCC strategies. In addition, the subdistrict LQAS results should help with development of context-specific messaging, as appropriate.
Conclusions and Recommendations
Support among pregnant women for goal-oriented ANC and giving birth at health facilities will help to enhance improved IYCF indicators such as breastfeeding of babies immediately after birth plus empowerment of expectant mothers with nutrition information through ANC counseling. ANC attendance and health facility deliveries increase health worker access to women during this critical time, which provides women with greater access to nutrition knowledge and information around proper nutrition habits.
SPRING needs to take advantage of integrated outreach service delivery models that are being championed by several partners in the country to increase access to nutrition services among target groups. USAID's existing partners, such as STAR-SW, STAR-EC, and others, have outreach models that mobilize large numbers of target group individuals for immunization, family planning, HIV and AIDS, and other services. Such mobilized target groups provide a good opportunity and platform for SPRING to consider in providing nutrition-based services and could perhaps help SPRING combat the low levels of respondents who report having received nutrition messages.
Given the role that family and community members play in sharing nutrition messages with mothers of children 0–23 months, improved male involvement interventions coupled with involvement of the civil society and religious leaders could help support and encourage mothers to improve nutrition practices among children and at the household level. The low levels of respondents who reported receiving nutrition messages indicates that there is room to scale up SBCC activities.
Evidence-based and district-centered information is vital for efficient allocation of scarce resources, planning, and decision making—and this can be made possible through the use of LQAS data at district or lower levels. Among intervention districts, there is a need to prioritize all intervention districts but with special emphasis on Ntungamo and Kisoro districts as they presented lower proportions on some IYCF indicator results when compared to Namutumba district. The focus should also be placed on the following IYCF and other indicators as they were found to have low performance: Minimum meal frequency, minimum acceptable diet, consumption of iron-rich or iron-fortified foods, and consumption of fortified foodstuffs such as maize flour and cooking oil. Consumption of fortified foods was found to be low, possibly due to low household incomes or low availability of fortified products in the market.
Follow-up action research on some of the key indicator findings may be imperative to explain certain behaviors. As in other quantitative studies, numbers or proportions on their own may not fully explain some situations but can be supplemented with follow-up qualitative research findings. Therefore, a diagnostic study is recommended to follow up on some of the baseline findings that have been indicated in this report.
It is recommended that the next survey reconsiders the required LQAS sample per age category in order to fulfill the required level of precision for results on some of the affected WHO IYCF recommended indicators that had a sample size too low for the recommended analyses. A sample size of 95 or more biological mothers per district with children in the following age categories would be helpful: 0–5, 6–8, 12–15, and 20–23 months. Such a change to the sampling system can only be conducted, however, if more resources are available for data collection.
A benefit of using the Aggregated LQAS methodology rather than standard random sampling at the district level is the ability to classify SA performance to target intervention efforts in areas where they are most needed. Overall, these baseline findings should help SPRING target its programming to lower-performing areas and assess the need for different types of programs across its districts as a whole.
Footnotes
1 However, Rubirizi and Buhweju districts did not have more than four subcounties (supervision areas). Therefore the sample size in each of their supervision areas was increased to 24 villages where 24 respondents were obtained per target group.
2 The biological mothers with children 0–11 months questionnaire included the following modules: the WHO 2010 "indicators for assessing infant and young child feeding practices–part 2 measurement"; a behavioral change communication module on nutrition; maternal and child health; malaria management; HIV/AIDS knowledge, practices, and perceptions module as well as one on water and sanitation. It is worth noting that many of these indicators collected are standard Feed the Future indicators, used by USAID and USAID Implementing Partners.
3 The biological mothers 12–23 months questionnaire included all the 0–11 months target group modules plus the immunization module.
4 The men 15–54 years questionnaire included the following modules: a behavioral change communication module on nutrition HIV and AIDS knowledge, practices, and perceptions; a module on water and sanitation within the household, and a module on the household's experiences with care and support of sick people in the home.
5 The team of supervisors consisted of seven personnel (one of them provided the overall technical oversight and support supervision and six district-specific consultants extended technical assistance to district participants during the execution of this methodology in each district).
6 It is important to note that for HIV-positive women, it is only recommended to continue breastfeeding through one year of age (WHO 2013). In this survey, respondents were not asked about their HIV status, but it is conceivable that some of the women interviewed were HIV positive and should only breastfeed their children up to one year of age.
7 Iron-rich foods investigated as part of this survey include the WHO recommended food groups that include: liver, kidney, heart or other organ meats; any meat such as beef, pork, lamb, goat, chicken, or duck; fresh or dried fish, shellfish or seafood.
8 Iron-fortified foods investigated during the survey include any foods to which iron-fortified powder or sprinkles were added.
9 As described earlier, mothers who are HIV-positive are discouraged from continuing breastfeeding past one year of age. While the survey did not assess HIV status, it is possible that some of the women interviewed are HIV-positive and should not be continuing to breastfeed children over one year of age.
10 Milk and other milk products assessed included: fresh animal, tinned, or powdered milk; infant formula such as NAN, LACTOGEN, SMA GOLD, COW & GET, and yogurt or bongo.
References
Black, Robert E., Lindsay H. Allen, Zulfiqar A. Bhutta, Laura E. Caulfield, Mercedes de Onis, Majid Ezzati, Colin Mathers, and Juan Rivera. 2008. "Maternal and Child Undernutrition: Global and Regional Exposures and Health Consequences." The Lancet 371 (9608): 243–60.
Businge, Denis, M.O. Smith, Samson Kironde, and Anthony Begumisa. 2012. STAR-EC LQAS Survey Report 2012: A Health Facility Assessment and Household LQAS Survey on HIV/AIDS and TB Interventions in Nine Districts in East Central Uganda.
Lemeshow, Stanley, and Scott Taber. 1991. "Lot Quality Assurance Sampling: Single and Double-Sampling Plans." World Health Statistics Quarterly 44, no. 3: 115–132.
Uganda Bureau of Statistics (UBOS) and Macro International Inc. 2011. Uganda Demographic and Health Survey, 2011. Calverton, Maryland, USA: UBOS and Macro International Inc.
Uganda Ministry of Health (MOH) and ICF International. 2012. 2011 Uganda AIDS Indicator Survey: Key Findings. Calverton, Maryland, USA: MOH and ICF International.
Valadez, Joseph J., William Weiss, Corey Leburg, and Robb Davis. 2002. Assessing Community Health Programs: A Participants Manual and Workbook: Using LQAS for Baseline Surveys and Regular Monitoring. London: Teaching Aids at Low Cost (TALC).
WHO. 2005. Guiding Principles for Feeding Non-breastfed Children 6–24 Months of Age. Geneva: WHO.
WHO. 2010a. Guidelines on HIV and Infant Feeding, 2010. Geneva: WHO.