Overview of the Global Anemia Problem, Including Iron Deficiency Anemia
The World Health Organization (WHO) defines anemia among women of childbearing age as the condition of having a hemoglobin concentration of < 12.0 g/dL at sea level; among pregnant women it is defined as < 11.0 g/dL. The hemoglobin concentration cutoff level that defines anemia varies by age, gender, physiological status, smoking status, and the altitude at which the assessed population lives.
The primary cause of anemia is iron deficiency, a condition caused by inadequate intake or low absorption of iron, the increased demands of repeated pregnancies—particularly if not well spaced (e.g., fewer than 36 months between pregnancies)—and loss of iron through menstruation. Other causes of anemia include vitamin deficiencies (such as a deficiency of folic acid or vitamin A), genetic disorders, malaria, parasitic infections, HIV, tuberculosis, common infections, and other inflammatory conditions. While iron deficiency anemia (IDA) accounts for about onehalf of all anemia cases, it often coexists with these other causes.
Iron deficiency anemia is most common during pregnancy and in infancy, when physiological iron requirements are the highest and the amount of iron absorbed from the diet is not sufficient to meet many individuals’ requirements (Stoltzfus and Dreyfuss 1998). Anemia’s effects include increased risk of premature delivery, increased risk of maternal and child mortality, negative impacts on the cognitive and physical development of children, and reduced physical stamina and productivity of people of all ages (Horton and Ross 2003). Globally, IDA annually contributes to over 100,000 maternal deaths (22 percent of all maternal deaths) and over 600,000 perinatal deaths (Stoltzfus, Mullany, and Black 2004). Key anemia control interventions include promoting a diversified diet, iron-folic acid (IFA) supplementation during pregnancy, iron fortification of staple foods, prevention and treatment of malaria, use of insecticide-treated bed nets, helminth prevention and control, delayed cord clamping, and increased birth spacing.
Maternal Anemia in Uganda
The prevalence of anemia among pregnant women in Uganda is 31 percent, making it a moderate public health problem as defined by WHO standards1 (UBOS and ICF International 2012). In terms of anemia severity, the majority of cases among pregnant and breastfeeding or non-pregnant women reported in the 2011 Uganda Demographic and Health Survey (UDHS) are classified as mild or moderate.2 Less than one percent of anemia cases in pregnant and breastfeeding women and only one percent in non-pregnant women are diagnosed as severe. Between 2006 and 2011, the prevalence of maternal anemia fell from 39 percent and 33 percent among breastfeeding and non-pregnant women, to 26 percent and 20 percent, respectively. However, over this same period, the prevalence of anemia among pregnant women fell by less than one percent (UBOS and Macro International 2007).
Falter Points in Women's Consumption of Iron-Folic Acid During Pregnancy
WHO recommends that all pregnant women receive a standard dose of 30–60 mg iron and 400 μg folic acid beginning as soon as possible during gestation (WHO 2012a). Ideally, women should receive iron-containing supplements no later than the first trimester of pregnancy, which means ideally taking 180 tablets before delivery. It is important to note, that many countries aim for women to receive 90 or more tablets during pregnancy.
Figure 1 shows a decision-tree analysis of how well the Ugandan antenatal care (ANC) system distributes IFA, and identifies four potential points at which the system might falter (highlighted in orange). The figure tracks the number and percentage of women who obtained ANC, those who subsequently received and consumed at least one IFA tablet, and those who consumed the ideal minimum number of tablets.3 All data are based on UDHS questions asked of women who were in permanent unions and had been pregnant in the five years prior to being interviewed4 (UBOS and ICF International 2012).
Figure 1. Analysis of Falter Points Related to Distribution and Consumption of IFA through Uganda’s ANC Program in 2011, Women of Reproductive Age (15–49 years) n = 8,674
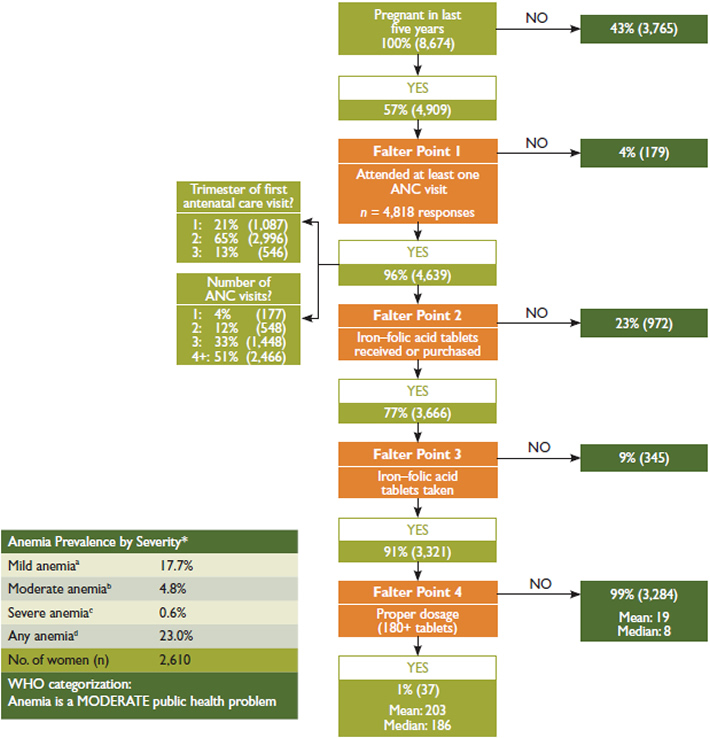
Main Conclusions: Uganda’s high ANC coverage makes it a strong vehicle for IFA distribution. Still, among women who were pregnant in the last five years and had at least one IFA tablet, only one percent received and took the ideal minimum number of tablets. The most important shortcoming is Falter Point 4, but Falter Point 2 is also significant. Supply and demand are both likely constraints.
Percentages are calculated from weighted data and may vary slightly from the unweighted observations-based calculations. Four percent of women who were pregnant in the last five years did not have any ANC visits but received or purchased IFA from another source.
*Percentage of women 15–49 years based on Hemoglobin levels, Hb (g/dL)
aaNPW 10.0≤Hb≤11.9, PW 10.0≤Hb≤10.9 bNPW 7.0≤Hb<9.9, PW 7.0≤Hb<9.9 ccNPW Hb<7.0, PW Hb<7.0 ddNPW Hb<12.0, PW Hb<11.0
Non-responses, no data (NR/ND) were recoded to “No” for ‘“At least one ANC visit?”, “IFA tablets received?” and “IFA tablets taken?” and to zero for “Number of tablets taken?”.
Anemia prevalence data are provided as a reference point, signaling the general order of magnitude of the anemia public health problem. The ANC utilization data is based on self-reported data of women 15–49 years in permanent unions and pertains to their last pregnancy in the last five years prior to the DHS.
Source: Calculations and anemia levels are from the Uganda Demographic and Health Survey (2011).
Many supply-side aspects—including both adequacy of IFA tablet supplies and technical knowledge and practices of ANC providers—need to be considered when assessing how well an ANC program delivers IFA. In addition, as Falter Point 4 in Figure 1 clearly shows, the provision of IFA tablets to a pregnant woman is a necessary but not sufficient condition for the woman to consume the tablets, particularly at the ideal minimum. Thus, demand-side factors also play a critical role in determining the coverage and effectiveness of a program. These include whether or not women seek ANC and the timing and number of visits, as well as the extent to which women are aware of the significance of anemia and IFA, ask for IFA tablets, and comply with the IFA regimen.
Understanding the relative significance of each falter point makes it possible to prioritize them for more in-depth analysis, providing a first step in an evidence- based approach to systematically improving the program. The DHS does not collect information on the number of IFA tablets received by women. In the case of Falter Point 4, this lack of data creates ambiguities that make it impossible to fully understand whether shortcomings of the system relate primarily to supply- or demand-side factors. Despite this limitation, the decision-tree analysis presented in Figure 1 still enables prioritizing the falter points for more in-depth analysis and action at the national, district, and health center levels.
Analysis of Falter Points
Falter Point 1:
Did not attend at least on ANC visit
Only four percent of women did not have at least one ANC visit.
ANC’s high coverage gives it great potential as a vehicle for providing IFA.
Falter Point 2:
Did not receive or purchase at least one IFA tablet
Of the women who had at least one ANC visit, 23 percent did not receive or purchase any IFA tablets.
This supply-side constraint is relatively large and may be due to various system/supply-side performance shortcomings, which could reflect: (1) inadequate supply (e.g., stockouts); (2) inadequate provider knowledge; or (3) inadequate provider practices, whereby IFA may not have been provided.
Unfortunately, the UDHS does not report the source(s) of the IFA tablets women received or purchased. However, women who attend ANC may be more likely to be aware of, to value, and also to take IFA tablets, regardless of where they obtain them. Thus, we would expect a high correlation between the number of women who had at least one ANC visit and those who received or purchased IFA, which is consistent with the data. While only two percent of Ugandan women who received or purchased IFA did not have any ANC visits, we cannot ascertain whether or not those who received ANC obtained their IFA from their ANC provider. What is known, however, is that women who had one or more ANC visits and who did not receive any IFA represent a missed opportunity to reduce the risk of anemia among a high-risk population.
Falter Point 3:
Did not take at least one IFA tablet
Of the women who received IFA, nine percent did not consume any tablets.
This demand-side constraint is small in Uganda, but is roughly double the percentage found in studies of 20 other low- and middle-income countries. These women may not understand the significance of anemia and/or the significance of IFA. This misunderstanding may reflect: (1) inadequate provider counseling and follow-up; (2) women’s beliefs about actual or possible side effects; or (3) sociocultural factors.
Falter Point 4:
Did not consume 180 or more IFA tablets
Of the women who received and took IFA, 99 percent did not consume the ideal minimum of 180 IFA tablets.
This constraint results from a combination of supplyand/ or demand-side factors, and as may be seen in Figure 1, is by far the most significant stumbling block in using the ANC platform to distribute IFA in Uganda. Previous research in Uganda found that providers reported having IFA stockouts about 50 percent of the time, and as a result rationed their supplies by not providing them to all pregnant women and/or dispensing less than the required number of tablets (Mwadime et al. 2004). Additionally, while most ANC clients were told of IFA and the recommended dosage, less than 10 percent were warned of potential side effects or how to deal with them.
Globally, research has found that the following situations often contribute to Falter Point 4: (1) providers do not have access to adequate supply; (2) women do not receive adequate tablets because they have little access to care, start ANC late, or do not have enough ANC visits, making it difficult to obtain 180 tablets (given IFA distribution protocols); (3) providers do not provide adequate counseling or follow-up; (4) women do not adhere to the regimen, which may be due to difficulty in remembering to take the tablets daily, not knowing all the tablets are necessary, fear of having a big baby, side effects, or tablet-related issues (taste, size, color, coating, packaging/storage problem). Further research is needed to determine the underlying factors contributing to this falter point in Uganda and to assess their relative importance so as to prioritize next steps.
Analysis by Sociodemographic Variables and Trends Over Time
Since at least 1995, Uganda has had ANC coverage rates in excess of 90 percent (Table 1). This is an impressive accomplishment. The pace of progress, however, has been uneven. Some key ANC indicators— for example, the timing of the first visit, the number of women with the recommended minimum four visits per pregnancy, and the average number of visits per pregnancy—have improved only slowly.
Table 2 shows the changes in anemia prevalence, IFA coverage, and the percentage of women consuming at least 90 IFA tablets during their pregnancy between 2006 and 2011 by region, residence area, and wealth. Uganda has made enormous strides in reducing anemia among women 15–49 years, cutting it by 53 percent—from 49 percent to 23 percent—over the five-year period. In 2006, anemia was at least a moderate public health problem in every region of the country and it was a severe public health problem in seven of the 10 regions, according to WHO standards. By 2011, it was only a mild public health problem in four regions and it remained a severe problem in only one. The decline in the prevalence of anemia in the North, Southwest, Western, and Central 1 regions was particularly rapid. Noteworthy progress was also experienced across all wealth quintiles and in both rural and urban areas. Among regional changes in the coverage of IFA (defined as the percentage of women, among all women who were pregnant in the past five years, who received and took at least one IFA tablet), the greatest improvements were in the Southwest, Western, and North regions, which were also the three regions with the largest percentage reductions in anemia. It is plausible that increased IFA coverage was a factor contributing to these large declines. Although the percentage of women consuming at least 90 IFA tablets—only one-half of the ideal minimum number of tablets—during their pregnancy increased between 2006 and 2011 across all regions and among all wealth quintiles and in both rural and urban areas, there remains much room for improving the distribution of IFA through ANC. Nationally, only four percent of women consumed 90 or more IFA tablets during pregnancy.
Table 1. Number and Timing of Antenatal Care Visits, Uganda 1995, 2000/2001, 2006, and 2011
| Indicator | 1995 | 2000/2001 | 2006 | 2011 |
|---|---|---|---|---|
| Number of ANC Visits | ||||
| Month of First Visit | ||||
| Median Months Pregnant at First Visit | ||||
| 0 | 8% | 6% | 5% | 4% |
| 1 | 6% | 8% | 6% | 4% |
| 2-3 | 37% | 42% | 42% | 42% |
| 4+ | 47% | 42% | 47% | 48% |
| Don't Know / No Data | 2% | 2% | 0% | 2% |
| No Antenatal Care | 8% | 6% | 5% | 4% |
| <4 | - | 14% | 17% | 21% |
| 4-5 | (<6) 48.6% | 35% | 41% | 44% |
| 6-7 | 37% | 38% | 33% | 28% |
| 8+ | 6% | 7% | 4% | 3% |
| Don't Know / No Data | 0% | 0% | 0% | 0% |
| 5.9 | 5.9 | 5.5 | 5.1 | |
Table 2. Anemia Prevalence, IFA Coverage, and 90+ IFA Tablet Consumption in Uganda Among Women (2006 and 2011)
| Characteristic | Anemia Prevalence | IFA Coverage | Took 90 + IFA | |||
|---|---|---|---|---|---|---|
| 2006 | 2011 | 2006 | 2011 | 2006 | 2011 | |
| Region | ||||||
| Residence | ||||||
| Wealth | ||||||
| Kampala | 32.7% | 19.6% | 76.3% | 83.9% | 2.9% | 10.1% |
| Central 1 | 57.5% | 23.5% | 70.2% | 69.8% | 2.0% | 1.7% |
| Central 2 | 42.9% | 30.9% | 68.9% | 77.5% | 0.6% | 4.9% |
| East Central | 48.2% | 29.9% | 67.0% | 69.6% | 0.3% | 1.1% |
| Eastern | 48.9% | 27.9% | 72.2% | 76.8% | 0.0% | 1.9% |
| Karamoja | NA | 43.3% | NA | 90.8% | NA | 2.0% |
| North | 64.0% | 13.1% | 62.0% | 81.3% | 0.7% | 6.7% |
| West Nile | 37.1% | 32.3% | 74.2% | 86.4% | 0.4% | 7.5% |
| Western | 45.1% | 17.3% | 54.6% | 73.3% | 0.4% | 4.0% |
| Southwest | 49.7% | 11.4% | 39.5% | 61.7% | 0.2% | 3.0% |
| Urban | 34.9% | 19.9% | 71.3% | 83.1% | 2.0% | 9.2% |
| Rural | 51.8% | 23.8% | 61.8% | 73.5% | 0.5% | 2.9% |
| Lowest | 57.8% | 28.6% | 66.8% | 75.4% | 0.6% | 3.2% |
| Second | 55.3% | 26.4% | 55.5% | 72.5% | 0.2% | 3.0% |
| Middle | 50.1% | 19.0% | 58.9% | 71.0% | 0.1% | 3.8% |
| Fourth | 47.2% | 22.2% | 64.2% | 74.6% | 0.1% | 1.8% |
| Highest | 39.0% | 20.5% | 71.0% | 81.4% | 2.5% | 7.5% |
| National Average | 49.0% | 23.0% | 63.1% | 75.1% | 0.7% | 3.9% |
Note: The 2006 and 2011 UDHS used a 90+ IFA tablet upper limit.
Analysis by Geographic Region
The map in Figure 2 shows the variation by region in the percentage of women who had at least one ANC visit and who received at least one IFA tablet. It reveals the overwhelming importance of ANC as the source of IFA for at least 70 percent of women in nine of Uganda’s 10 regions. The mean number of tablets taken does not exceed half of the ideal minimum number in any region (not shown). Formative research is required to gain a better understanding of the specific causes of the shortcomings contributing to the key falter points noted above and is essential to designing activities to effectively address them, including increasing the ANC-based distribution of IFA.
Figure 2. Percentage of Women Who Had at Least One ANC Visit and Received at Least One IFA Tablet by Region, Uganda, 2011
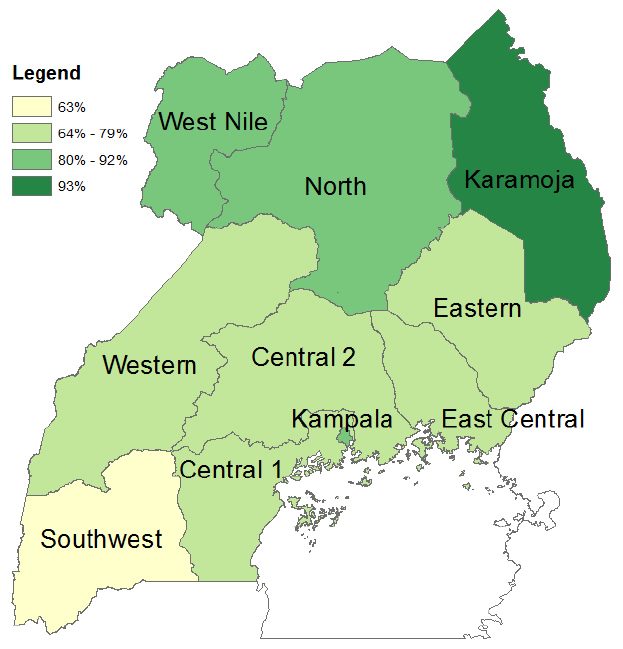
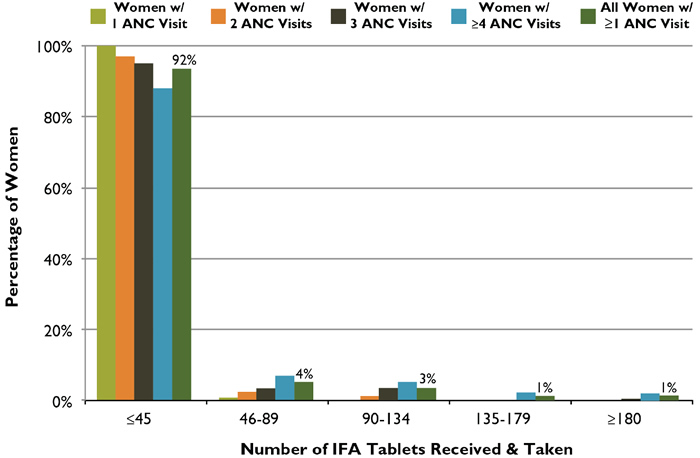
Figure 3. ANC Distribution of IFA Tablets: Number of Tablets Received and Taken According to Number of ANC Visits, Uganda, 2011
Overall Conclusions and Recommendations
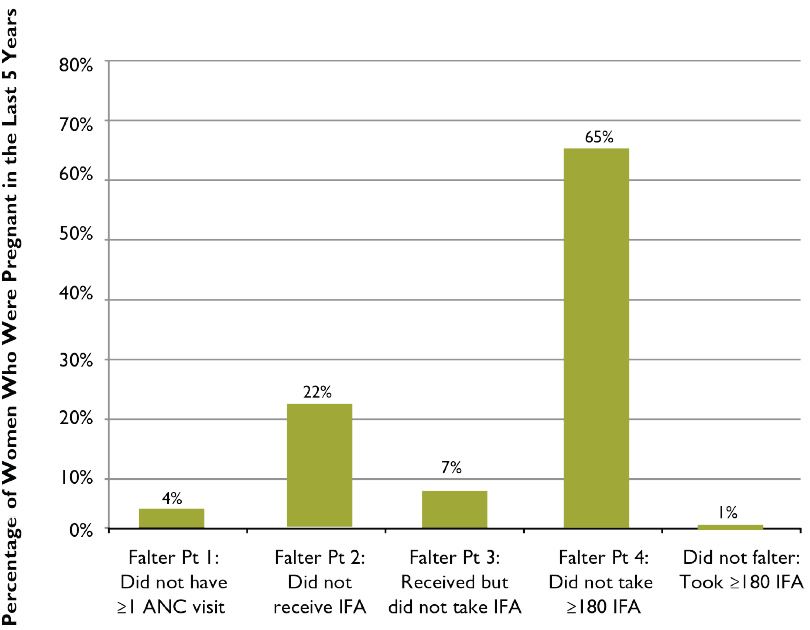
Figure 4 presents the obstacles among all women, including those who did not receive ANC during their pregnancy, to taking the ideal minimum number of IFA tablets. In Uganda, Falter Points 2 and 4 are the greatest barriers. Improving the delivery of IFA supplementation in Uganda will likely require identifying and addressing program gaps in IFA supply management and health workers’ practices (to improve performance at Falter Points 2 and 4). Modifying some women’s long-term adherence behaviors, and addressing other points mentioned above under “Analysis of Falter Points,” may also lead to more women taking an ideal minimum of 180 tablets (addressing Falter Point 4).
This rapid assessment of the distribution of IFA tablets through ANC in Uganda suggests that there is substantial room for improving both the supply and the demand sides of the program. Uganda has made notable progress in steadily reducing its maternal mortality rate (MMR), from 420 maternal deaths per 100,000 live births in 2005 to 310 maternal deaths per 100,000 live births in 2010 (WHO 2012b). It is highly likely that the reduction in anemia has been one important cause of the 26 percent reduction in the MMR, and it is plausible that the distribution of IFA through the ANC program has played a role as well. Uganda’s MMR remains very high, however. In 2010, it ranked 146th among WHO’s 181 reporting countries. Improving the distribution of IFA through the ANC program is an important strategy for preventing and controlling anemia in Uganda, and for improving the nutrition and health status as well as the mental and physical capacity of women of reproductive age.
Figure 4. Relative Importance of Each of the Falter Points in Uganda: Why Women Who Were Pregnant in the Last Five Years Failed to Take the Ideal Minimum of 180 IFA Tablets
Footnotes
1 WHO categorizes the severity of anemia as a public health problem according to the condition’s prevalence: < 5 percent, no public health problem; 5–19.9 percent, mild; 20–39.9 percent, moderate; ≥ 40 percent, severe.
2 The DHS hemoglobin levels used to diagnose the severity of anemia in non-pregnant women differ from those specified by WHO. The DHS cutoffs for pregnant (P) and non-pregnant (NP) women in hemoglobin g/ dL are mild, 10.0–10.9 (P), 10.0–11.9 (NP); moderate, 7.0–9.9 (P), 7.0–9.9 (NP); severe, < 7.0 (P), < 7.0 (NP); any, < 11.0 (P), < 12.0 (NP).
3 The UDHS asked about IFA tablets or capsules; this brief refers to all forms as “tablets.”
4 The UDHS provides a population-based, nationally representative sample of all women in Uganda.
References
Galloway, Rae. 2003. Anemia Prevention and Control: What Works. Washington, DC: USAID.
Horton, Sue and Jay Ross. 2003. “The Economics of Iron Deficiency.” Food Policy 28(1):51-75.
Ministry of Health (MOH) [Uganda]. 2002. National Anemia Policy. Kampala, Uganda: Ministry of Health, Government of Uganda.
Mwadime, Robert K. N., Philip W. J. Harvey, Sarah Naikoba, Louise Sserjongi, Hanifa Bachou, Loyce Arinaitwe, and Wamuyu G. Maina. 2004. Overcoming Barriers to Effective Maternal Anemia Interventions during Antenatal Services in Uganda. Arlington, Virginia: Micronutrient Opportunities, Strategies and Technologies, United States Agency for International Development.
Statistics Department [Uganda] and Macro International Inc. 1996. Uganda Demographic and Health Survey, 1995.
Calverton, Maryland: Statistics Department [Uganda] and Macro International Inc.
Stoltzfus, Rebecca J., and Michele L. Dreyfuss. 1998. Guidelines for the use of Iron Supplements to Prevent and Treat Iron Deficiency Anemia. Washington DC: ILSI Press.
Stoltzfus, Rebecca J., Luke Mullany, and Robert E. Black. 2004. “Iron Deficiency Anemia.” In Comparative Quantification of Health Risks: Global and Regional Burden of Disease Attributable to Selected Major Risk Factors, edited by Majid Ezzati, Alan D. Lopez, Anthony Rodgers, and Christopher J. L. Murray, 163-209. Geneva, Switzerland: World Health Organization.
Uganda Bureau of Statistics (UBOS) and ICF International Inc. 2012. Uganda Demographic and Health Survey 2011. Kampala, Uganda: UBOS and Calverton, Maryland: ICF International Inc.
UBOS and Macro International Inc. 2007. Uganda Demographic and Health Survey 2006. Calverton, Maryland: UBOS and Macro International Inc.
UBOS and ORC Macro. 2001. Uganda Demographic and Health Survey 2000-2001. Calverton, Maryland: UBOS and ORC Macro.
World Health Organization (WHO). 2012a. “Guideline: Daily Iron and Folic Acid Supplementation in Pregnant Women.” Geneva: WHO.
WHO. 2012b. Indicator and Measurement Registry version 1.6.0. Maternity mortality rate. http://apps.who.int/gho/indicatorregistry/App_Main/view_indicator.aspx?i.... (August 28, 2012).